Nevergrad Experiments
Using the nevergrad experimentation engine for each different project (i.e. recorded data sequence), the following plots and comparisons are obtained:
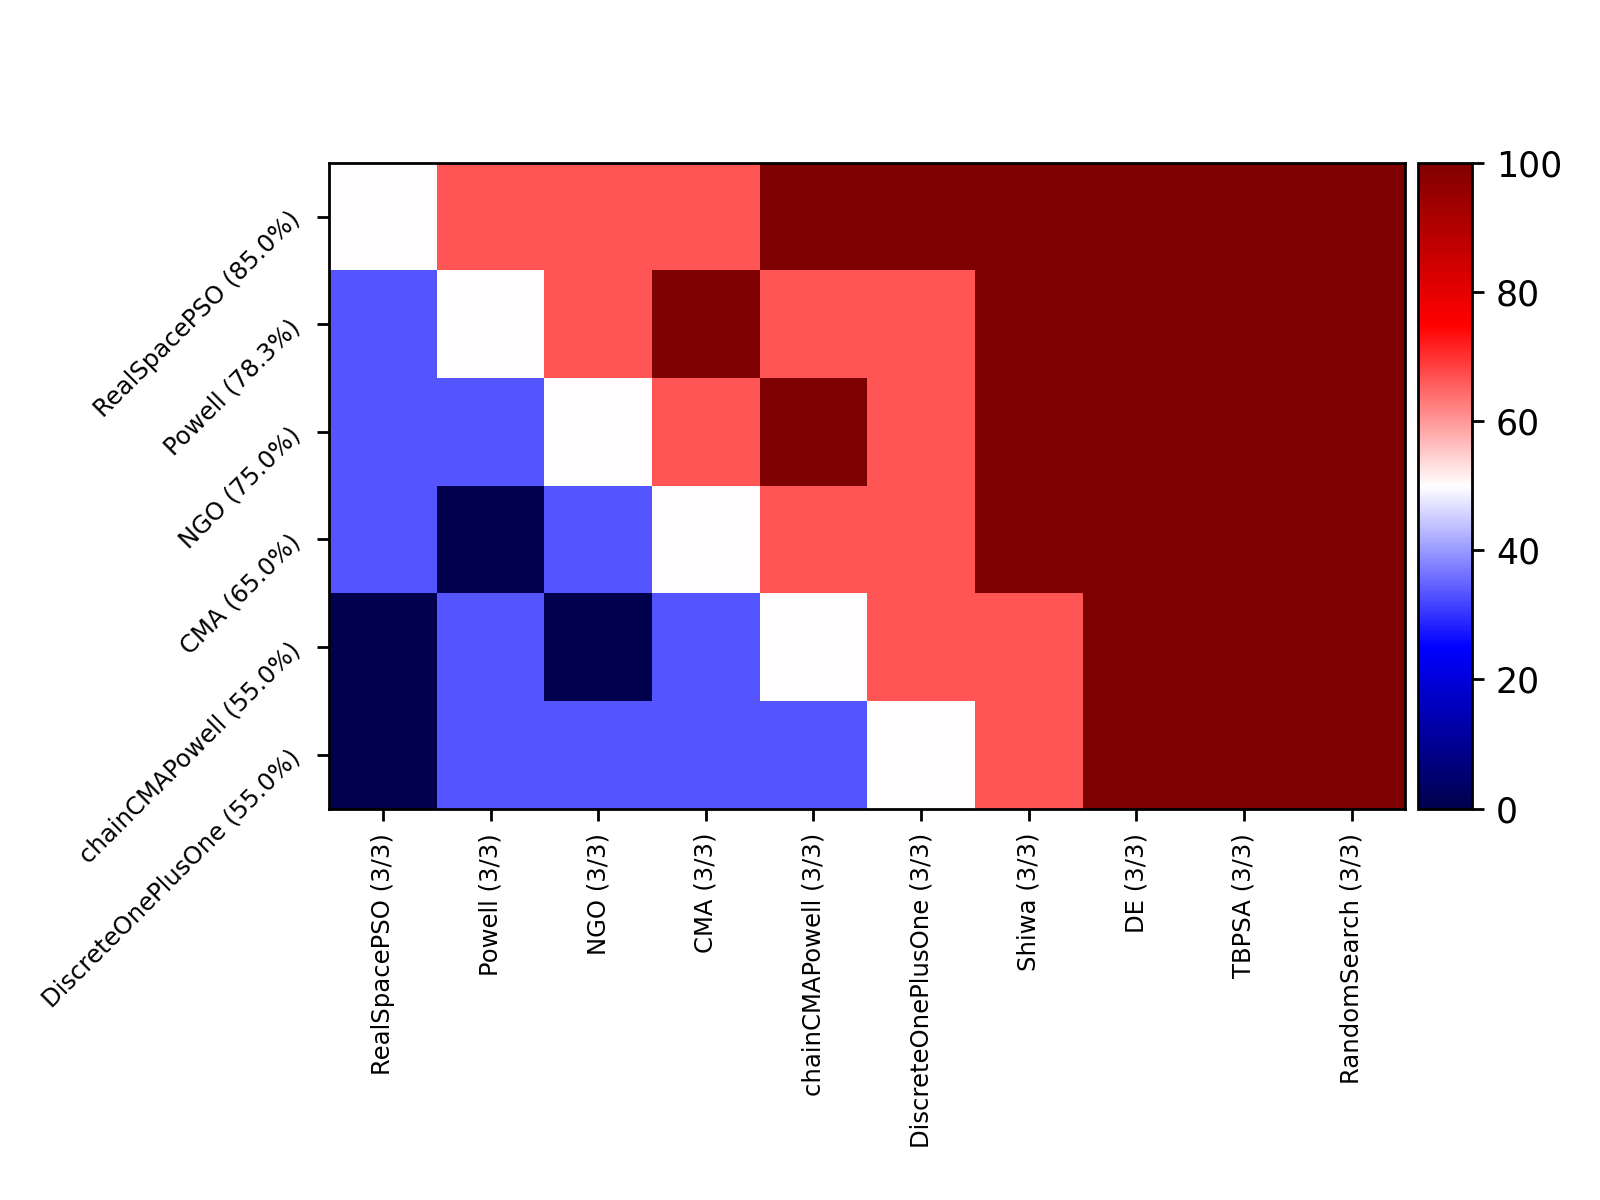
Project#1
Plot Comparison 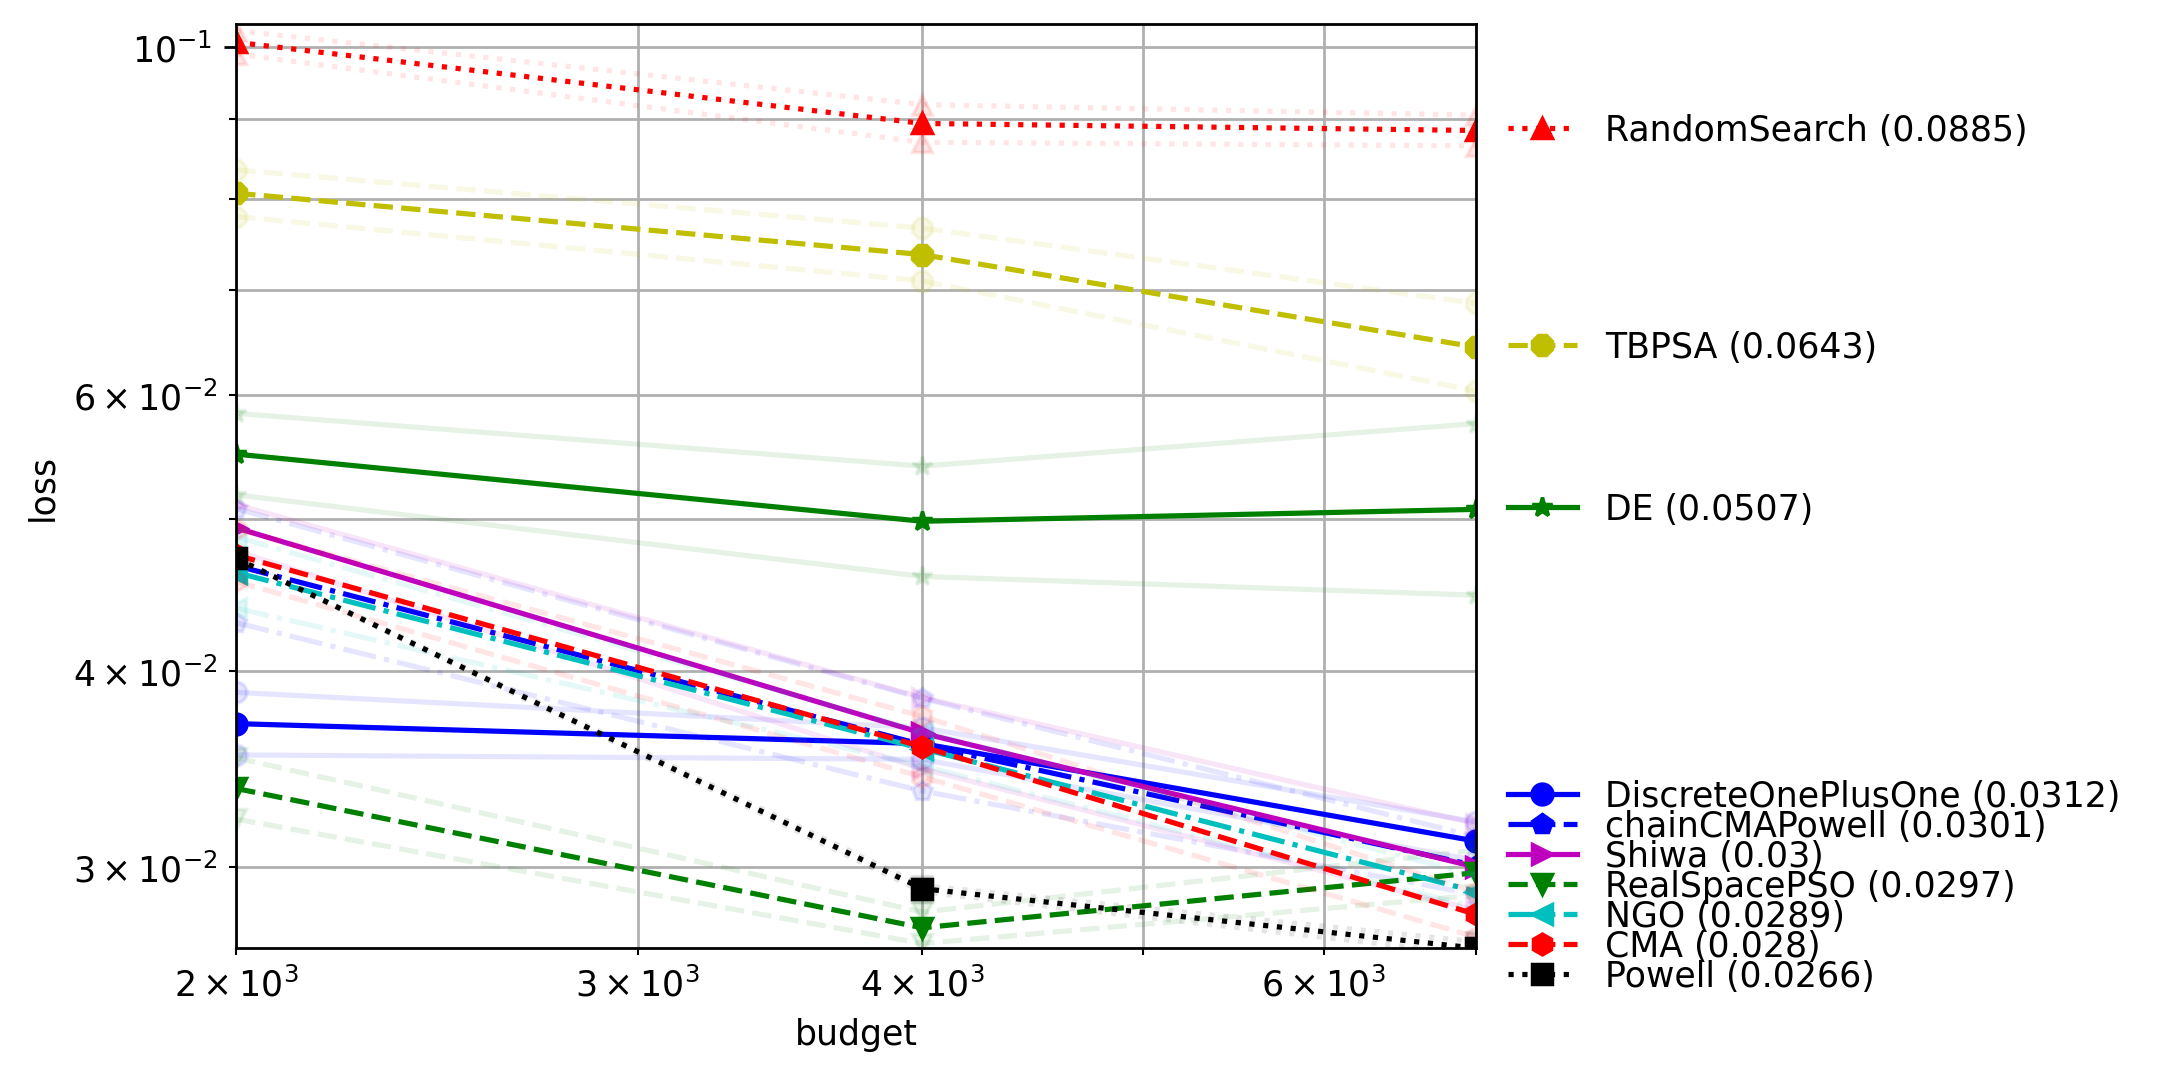
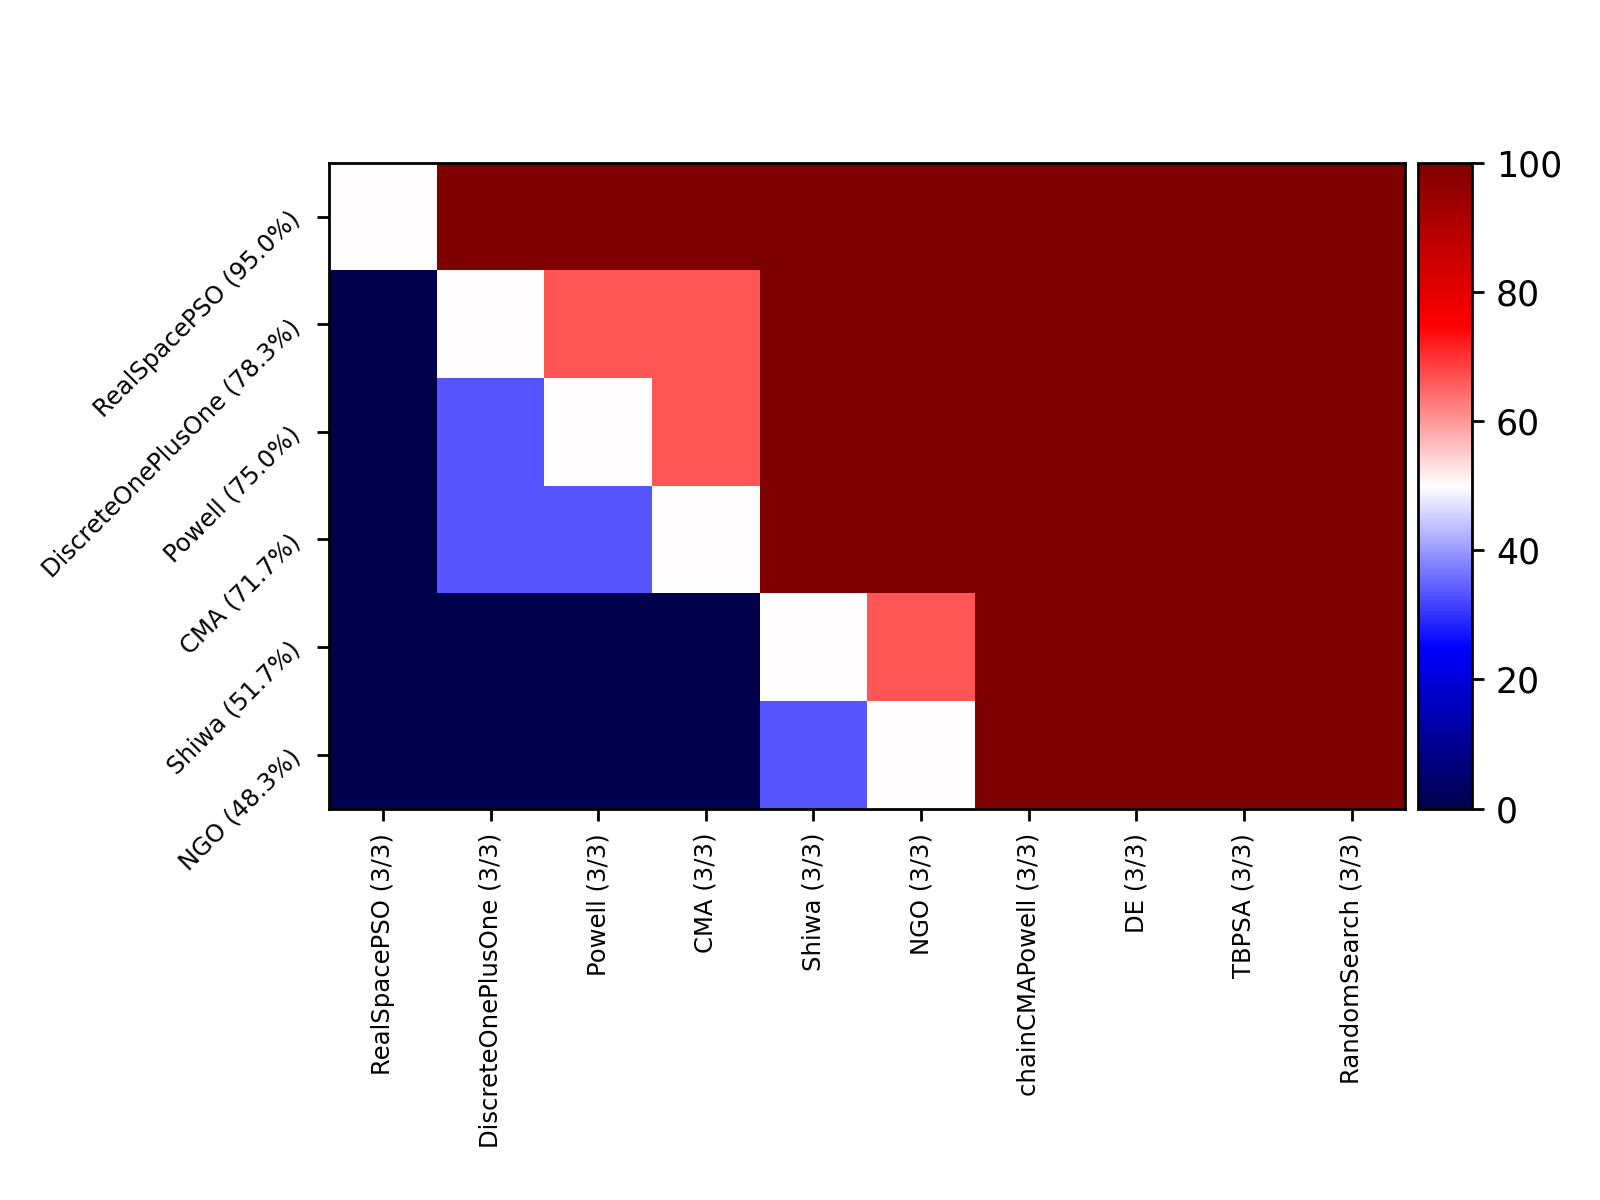
Project#2
Plot Comparison 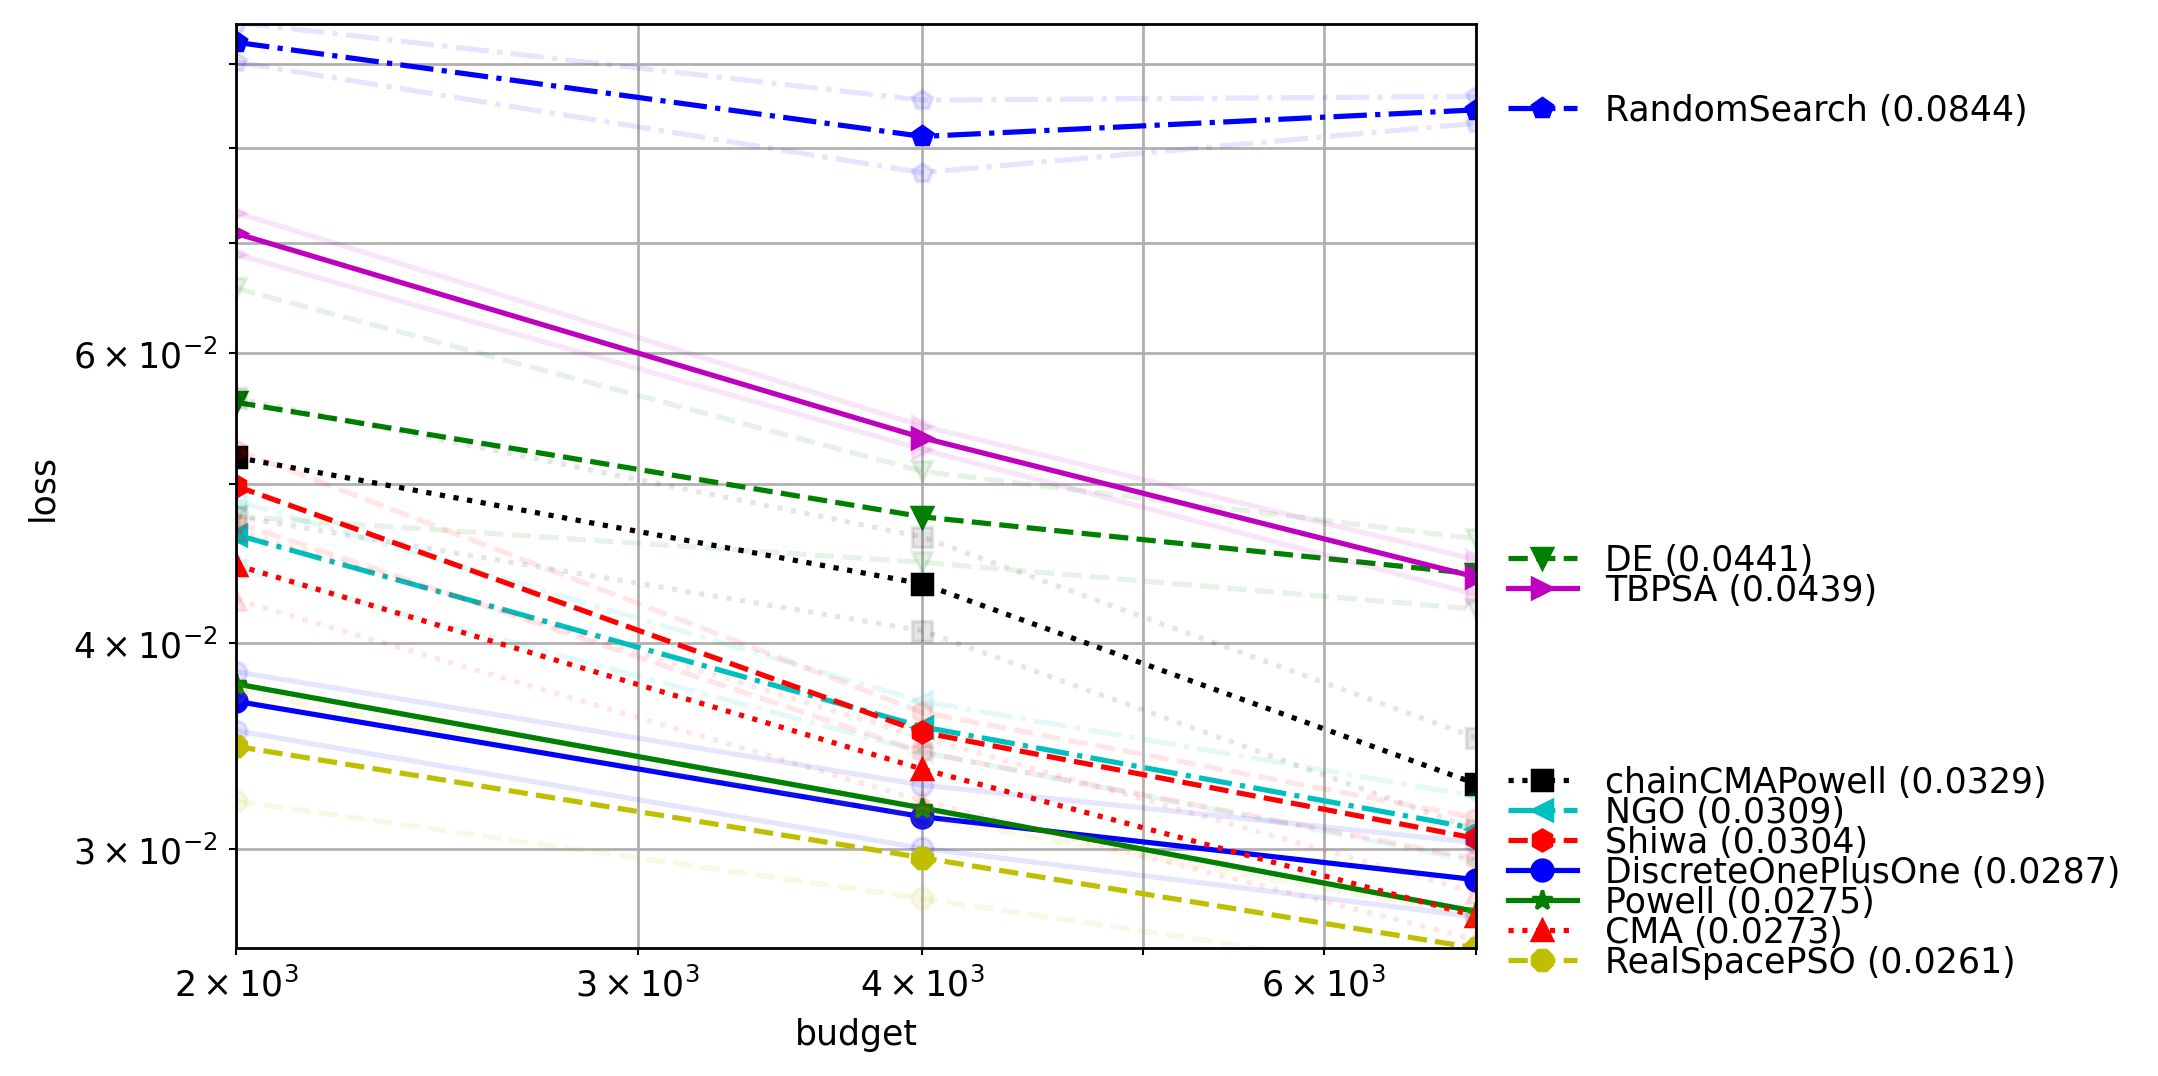
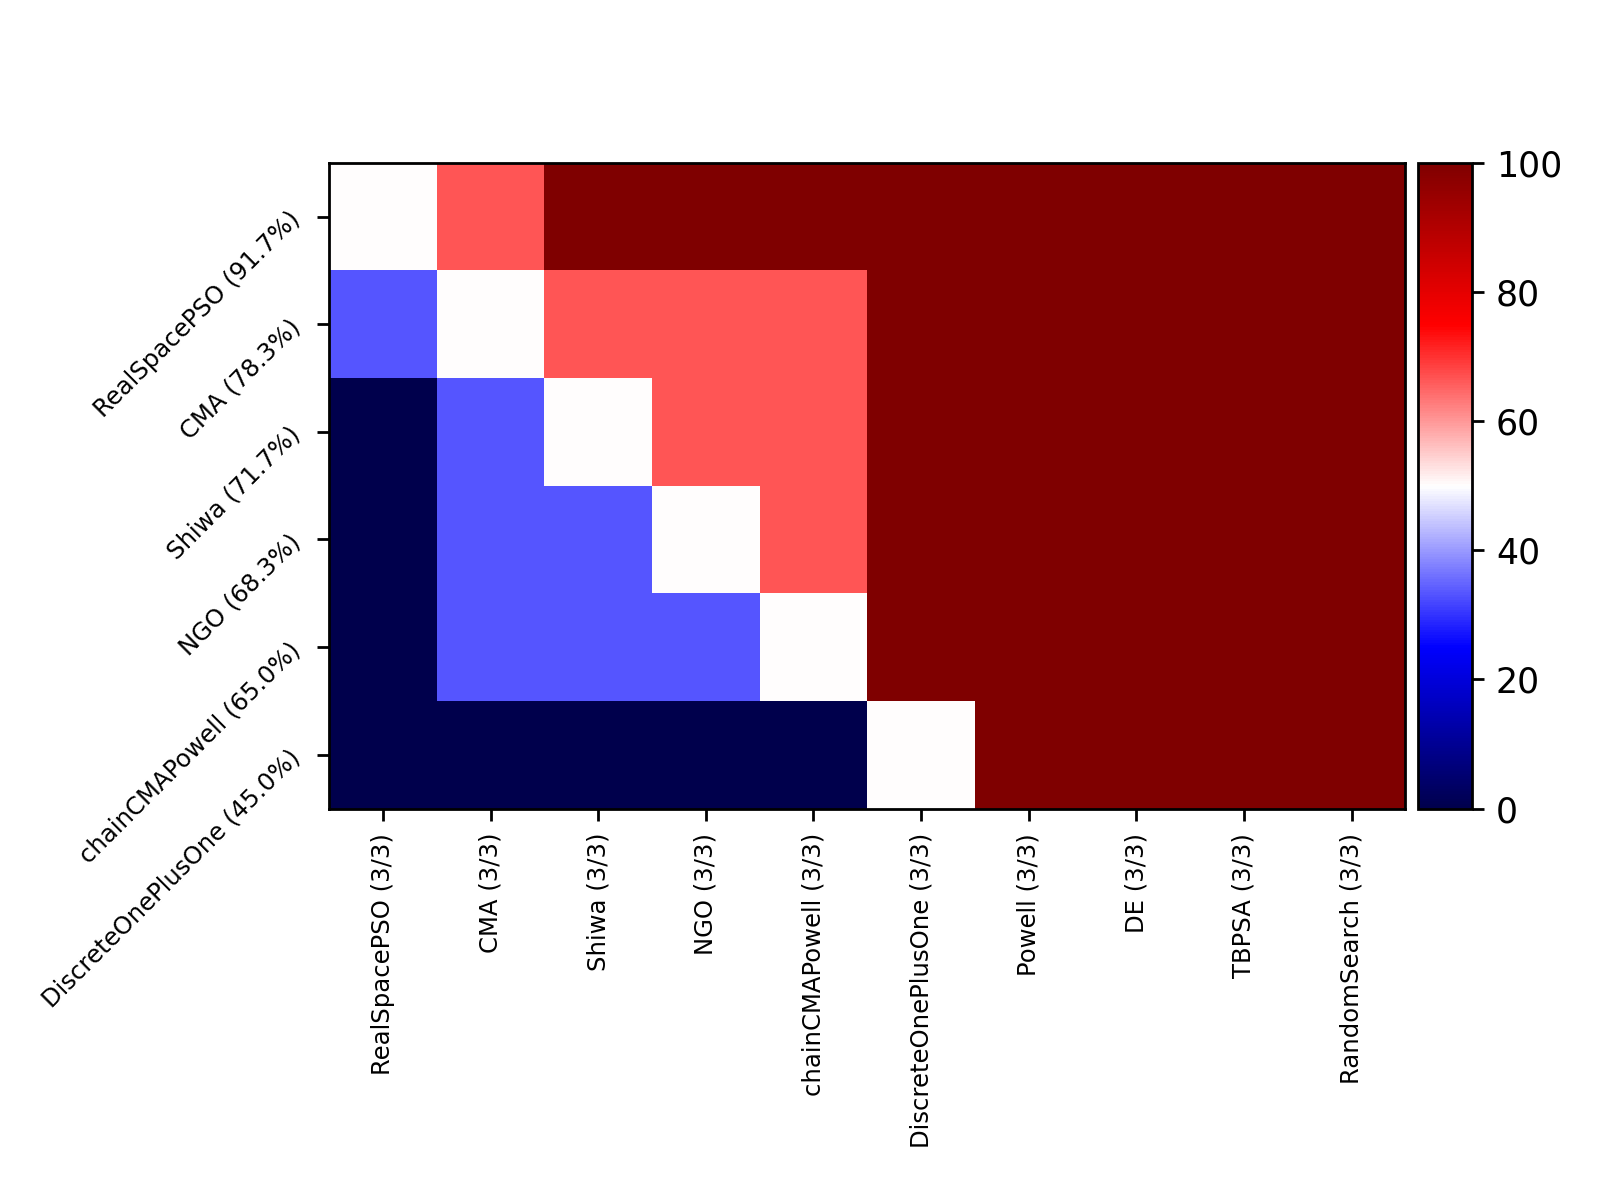
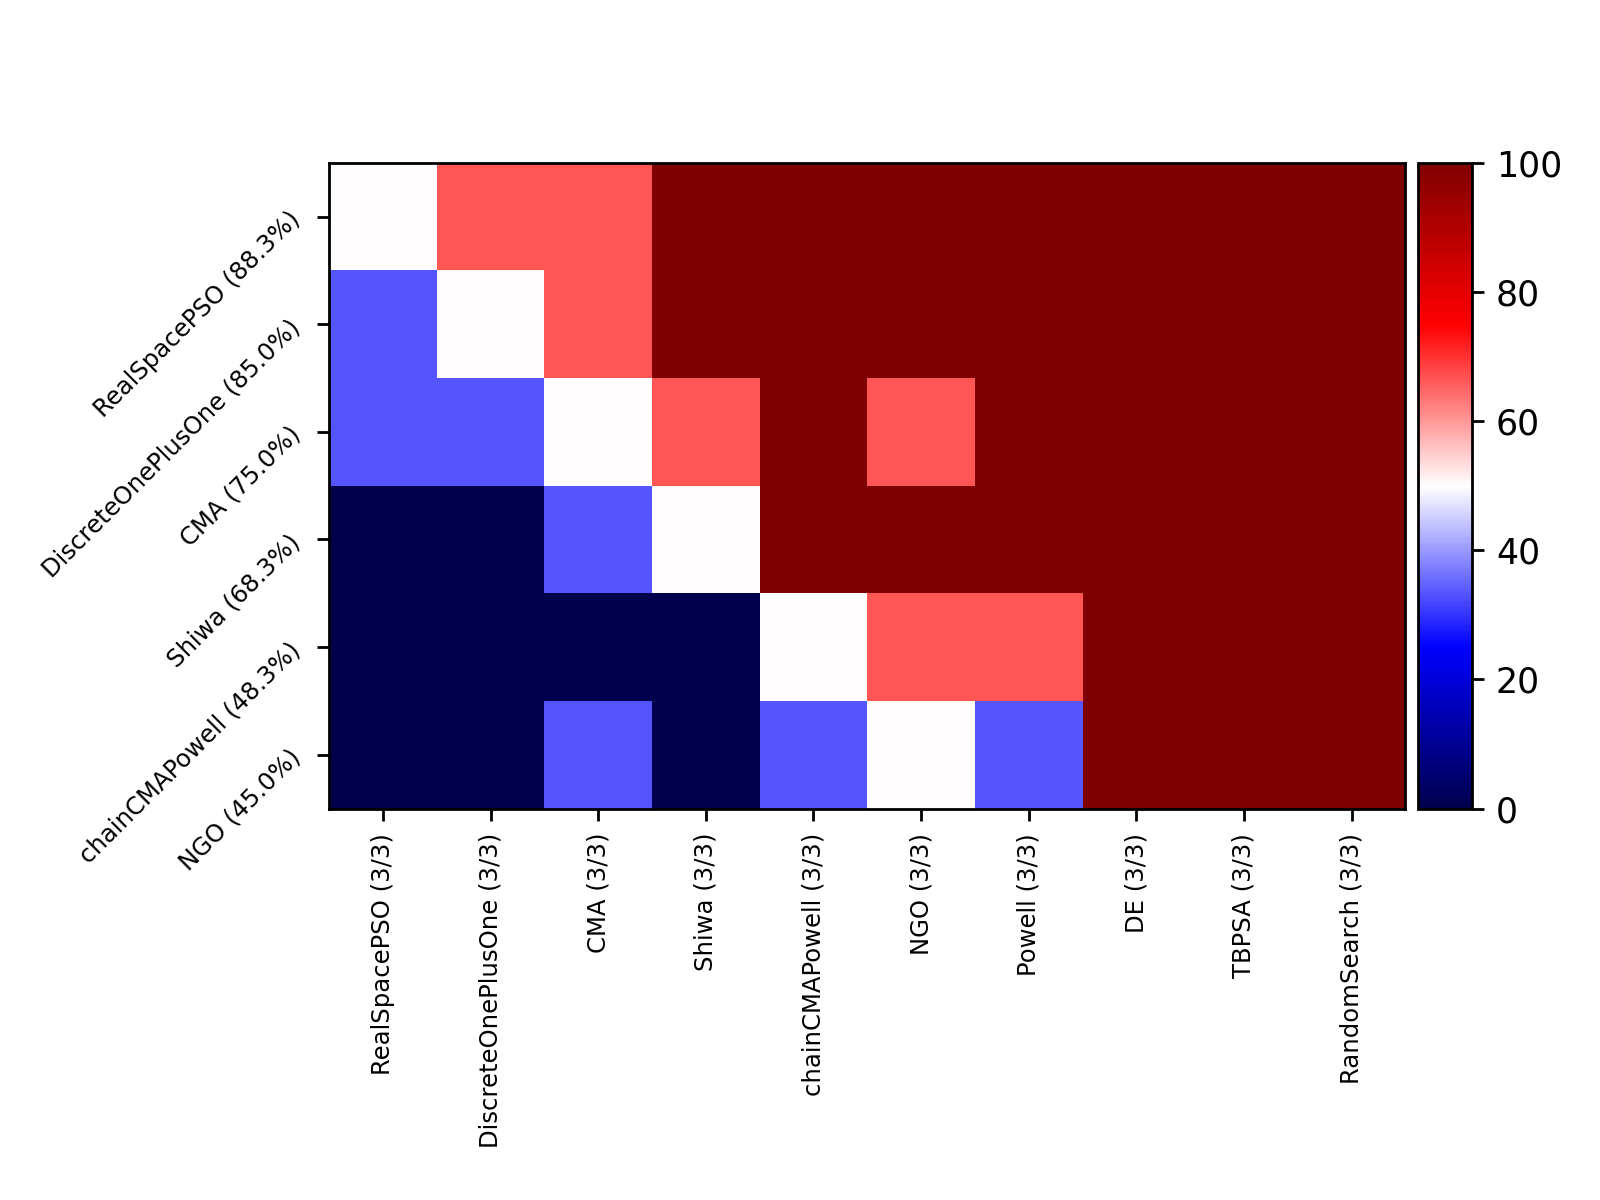
Project#3
Plot Comparison 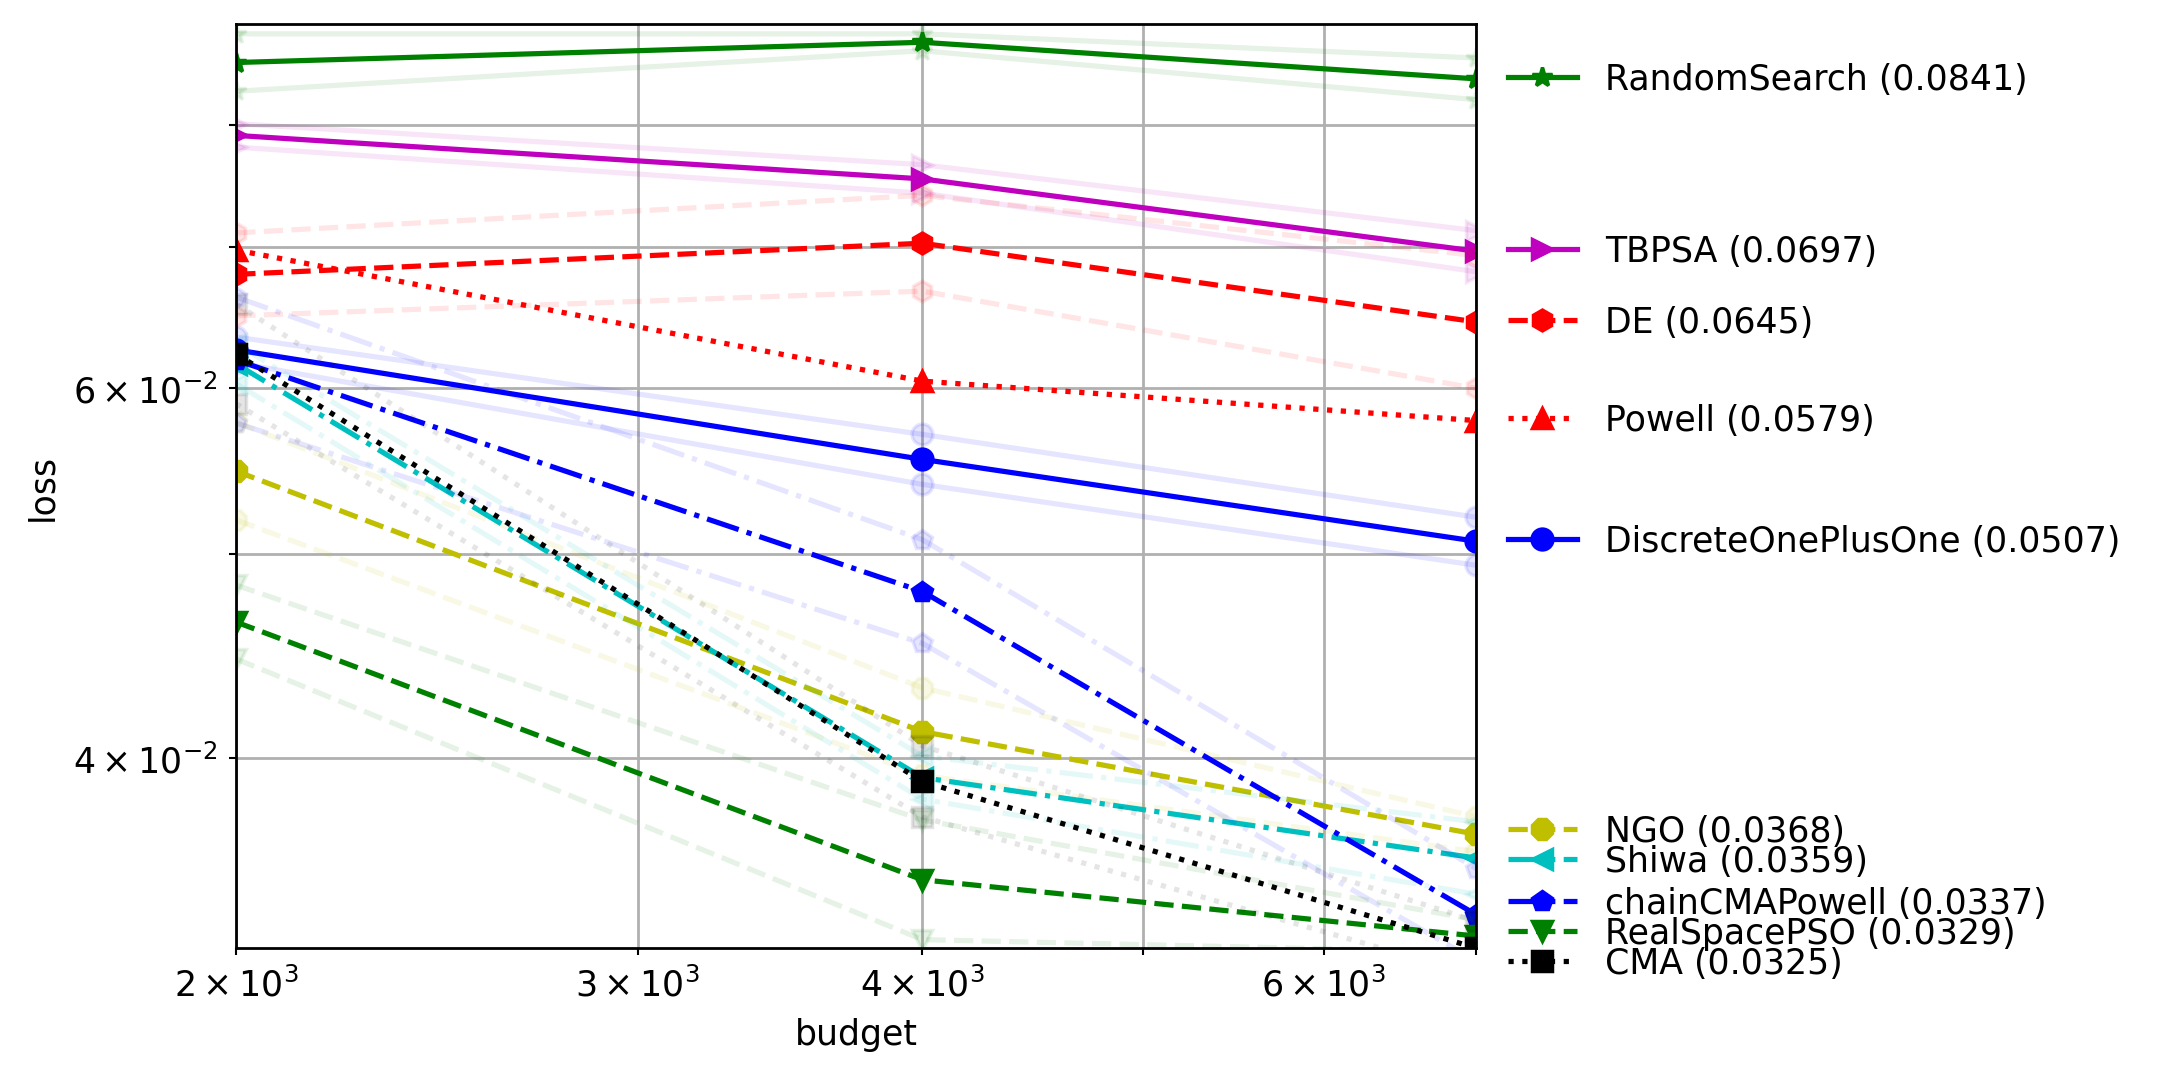
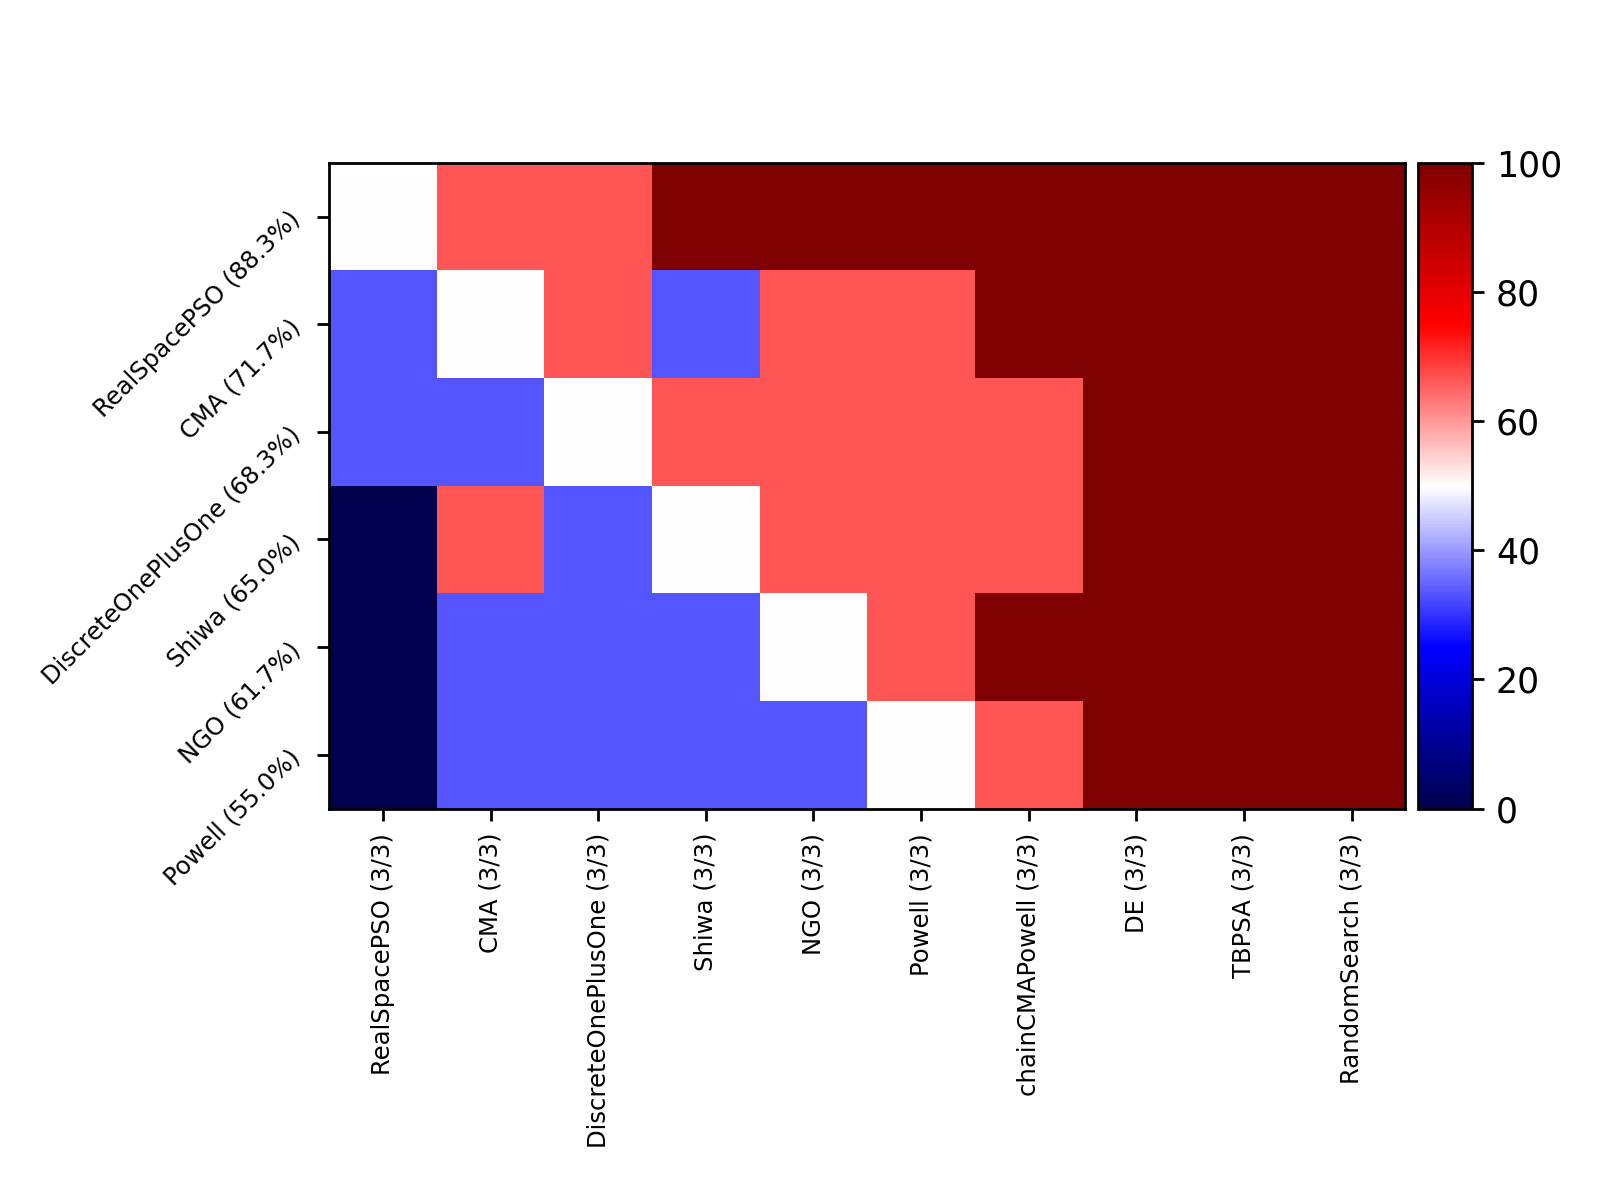
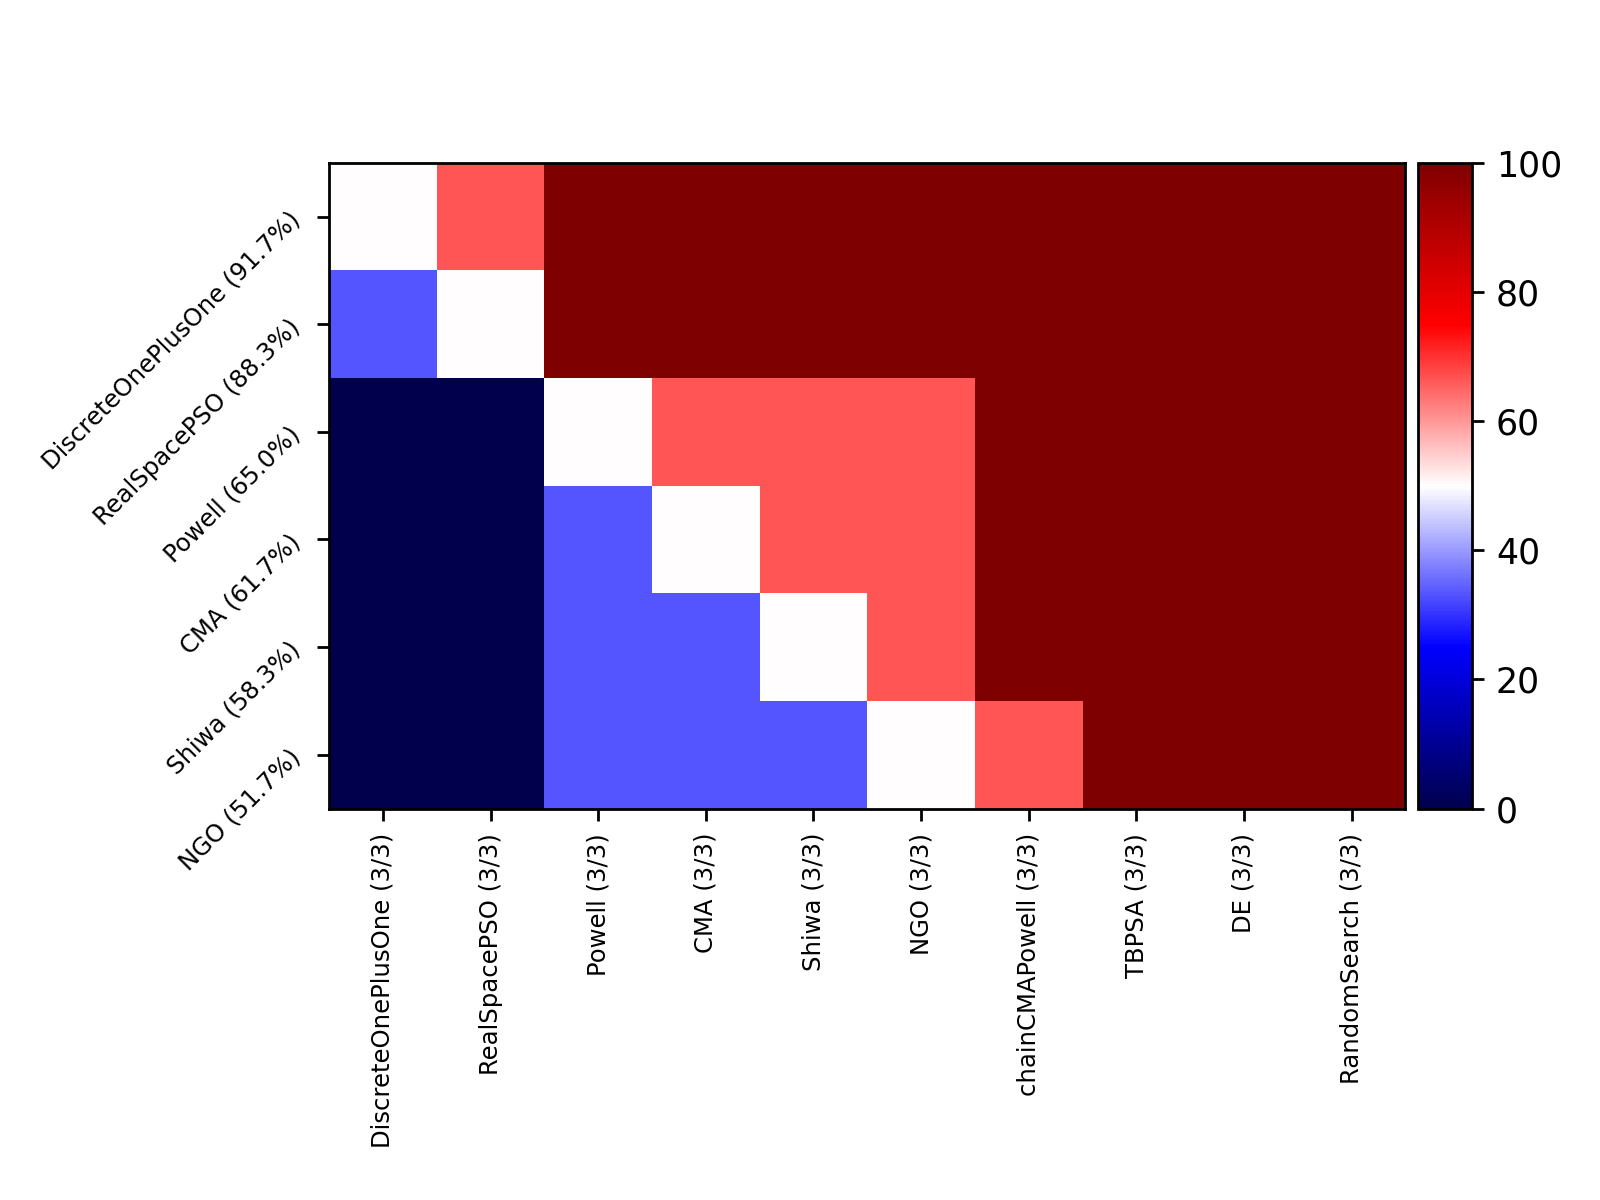
Project#4
Plot Comparison 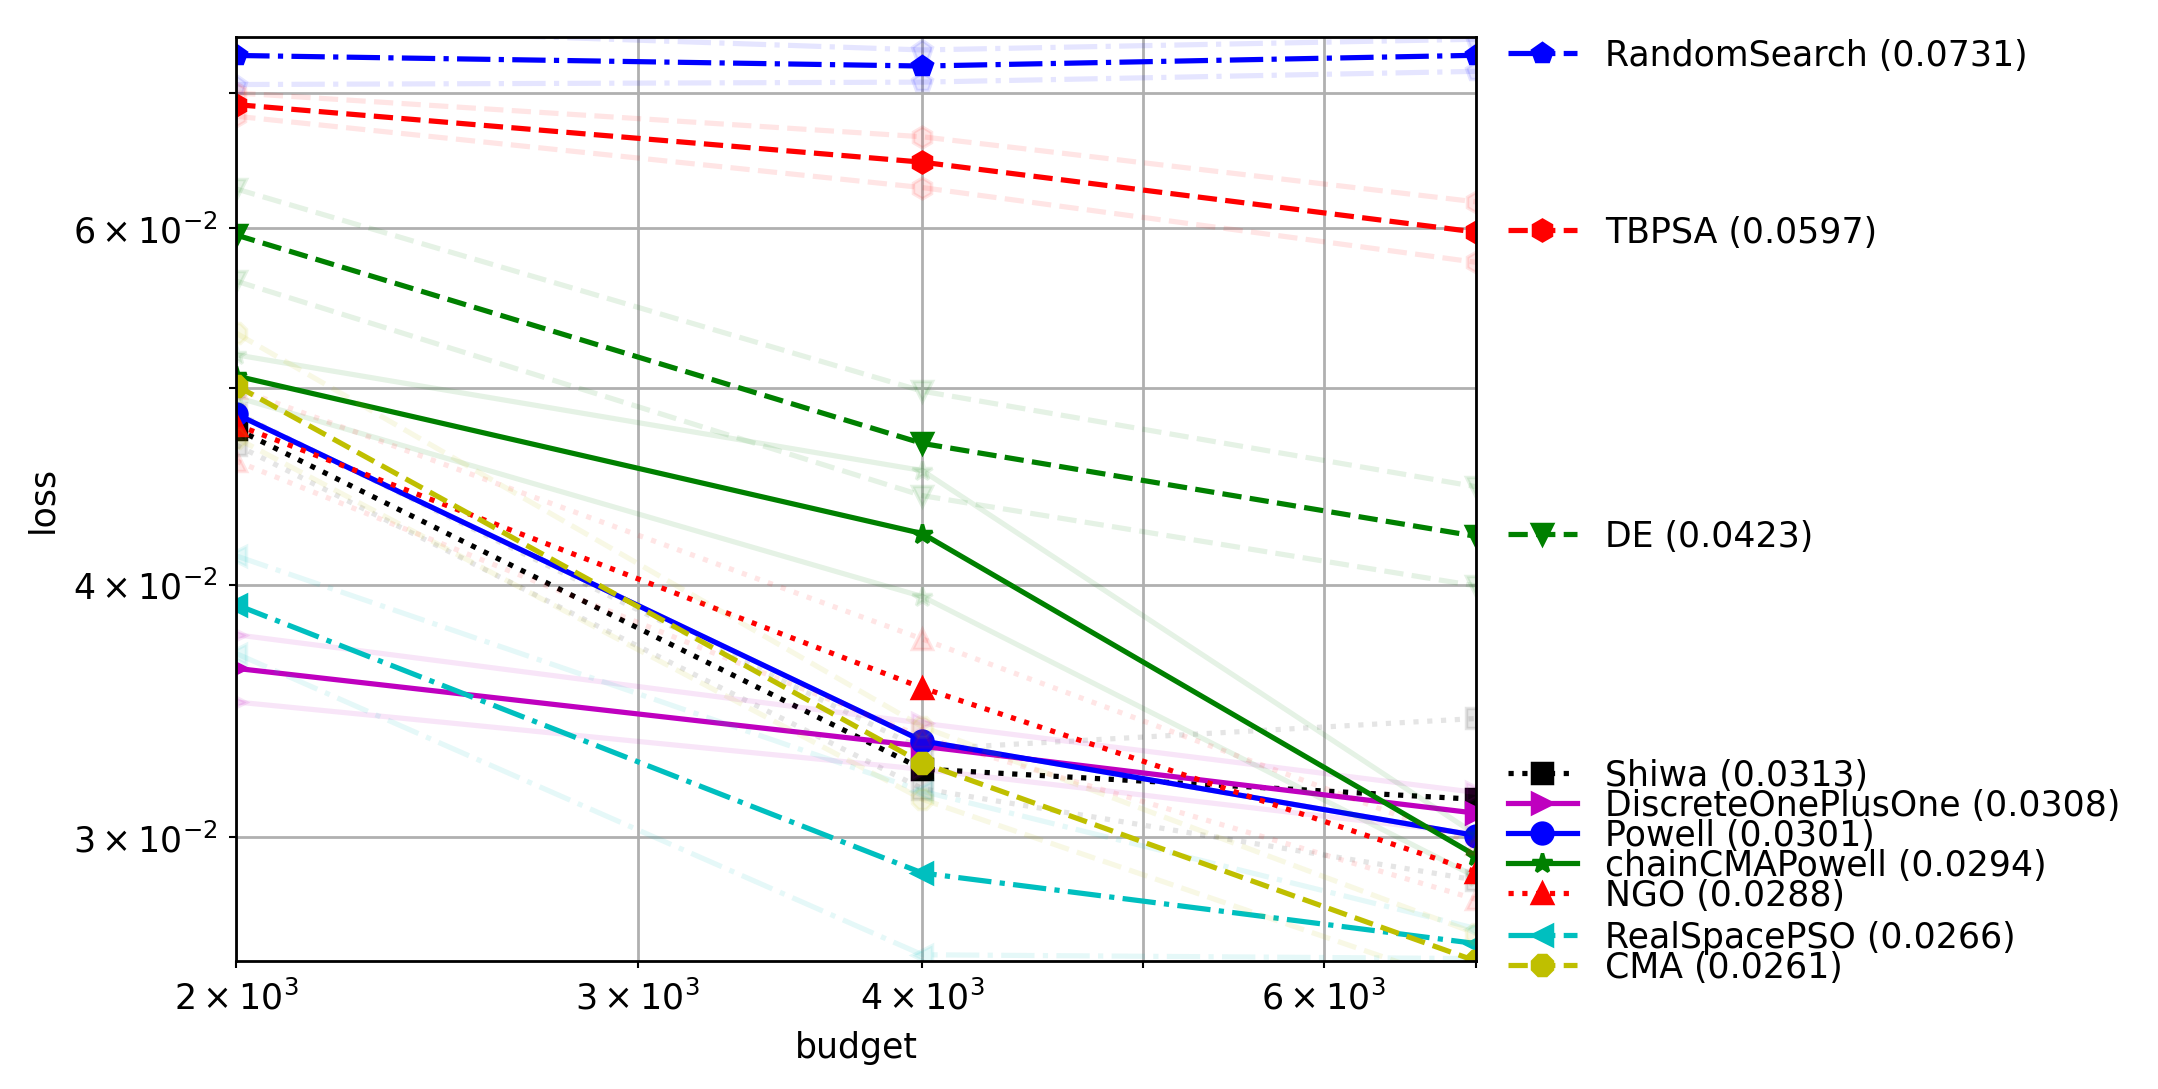
Project#5
Plot Comparison 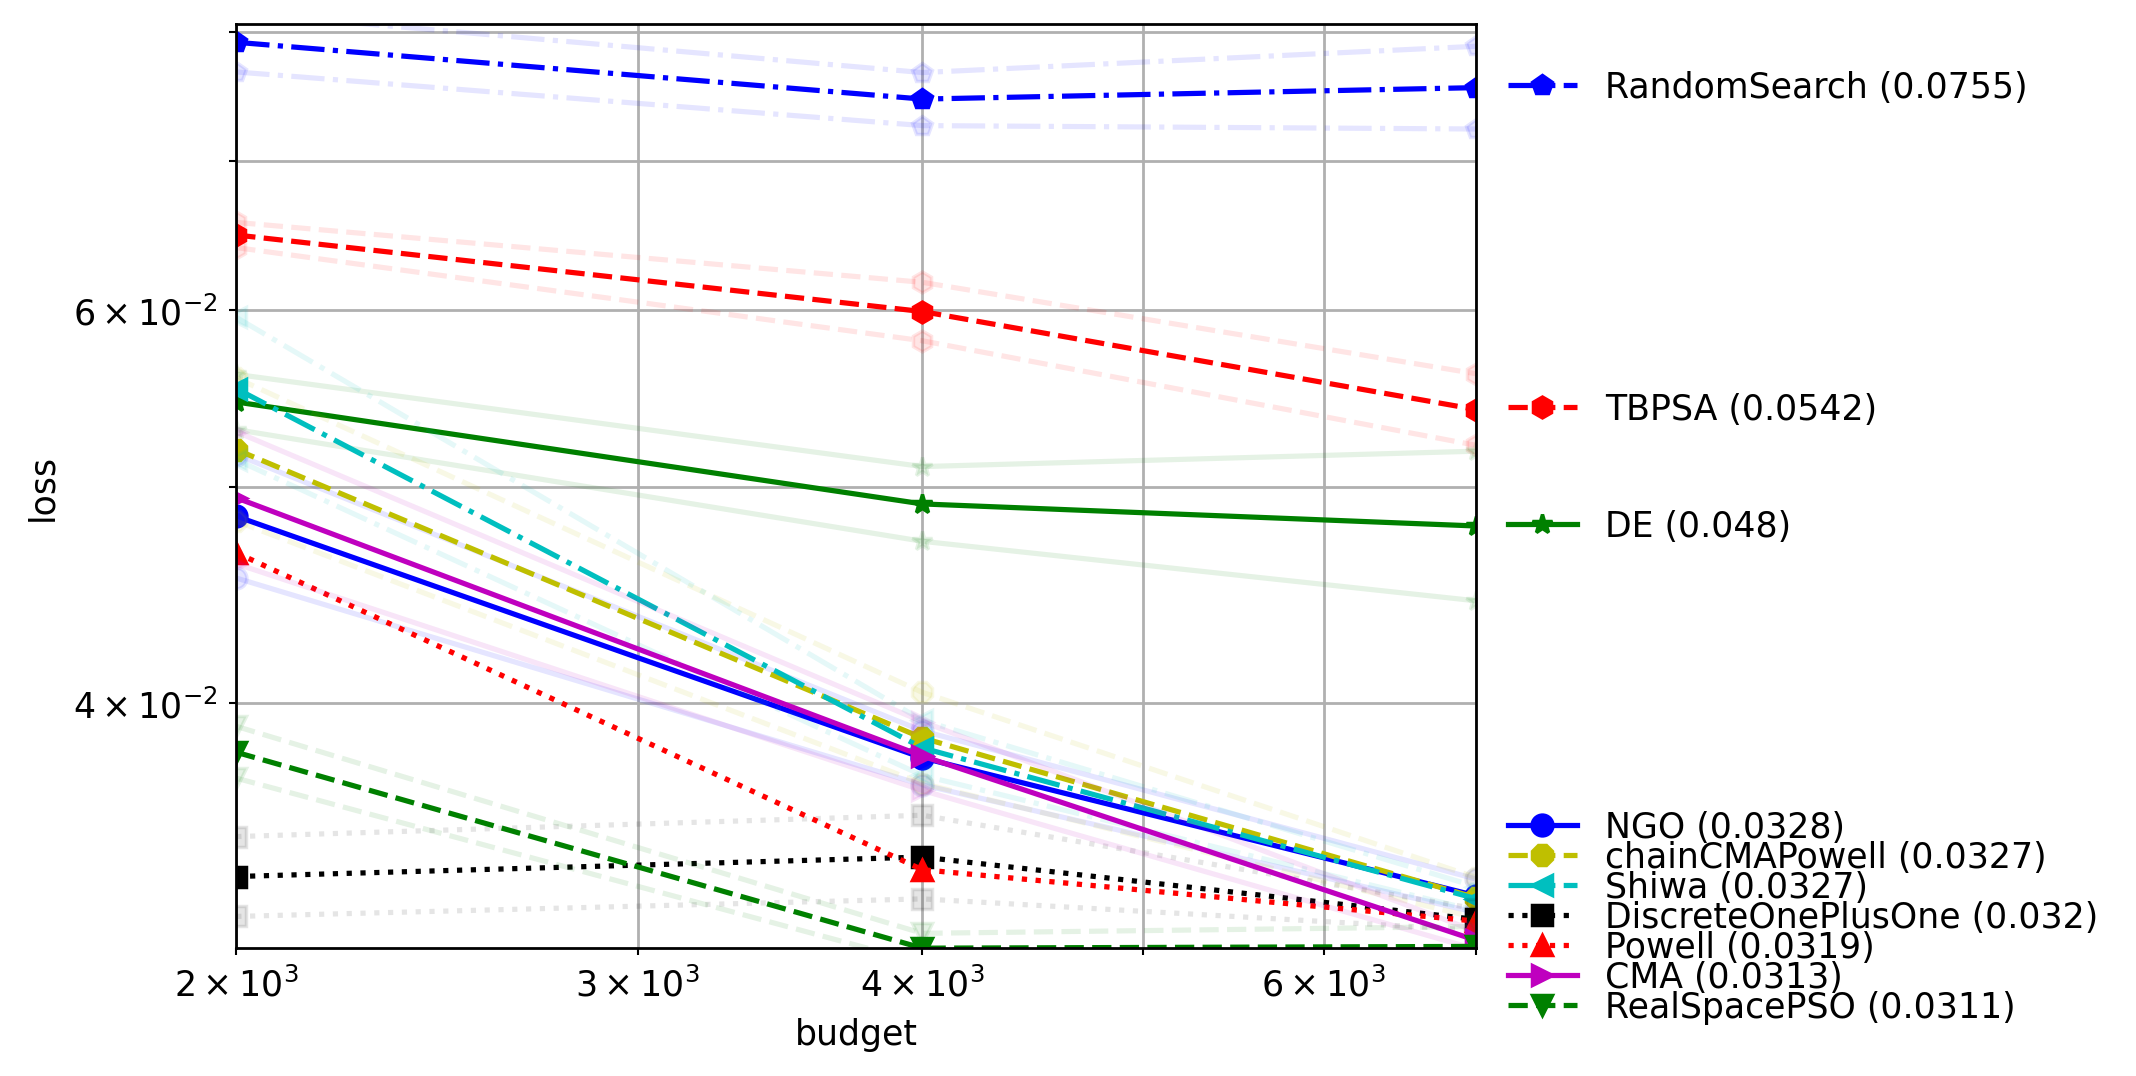
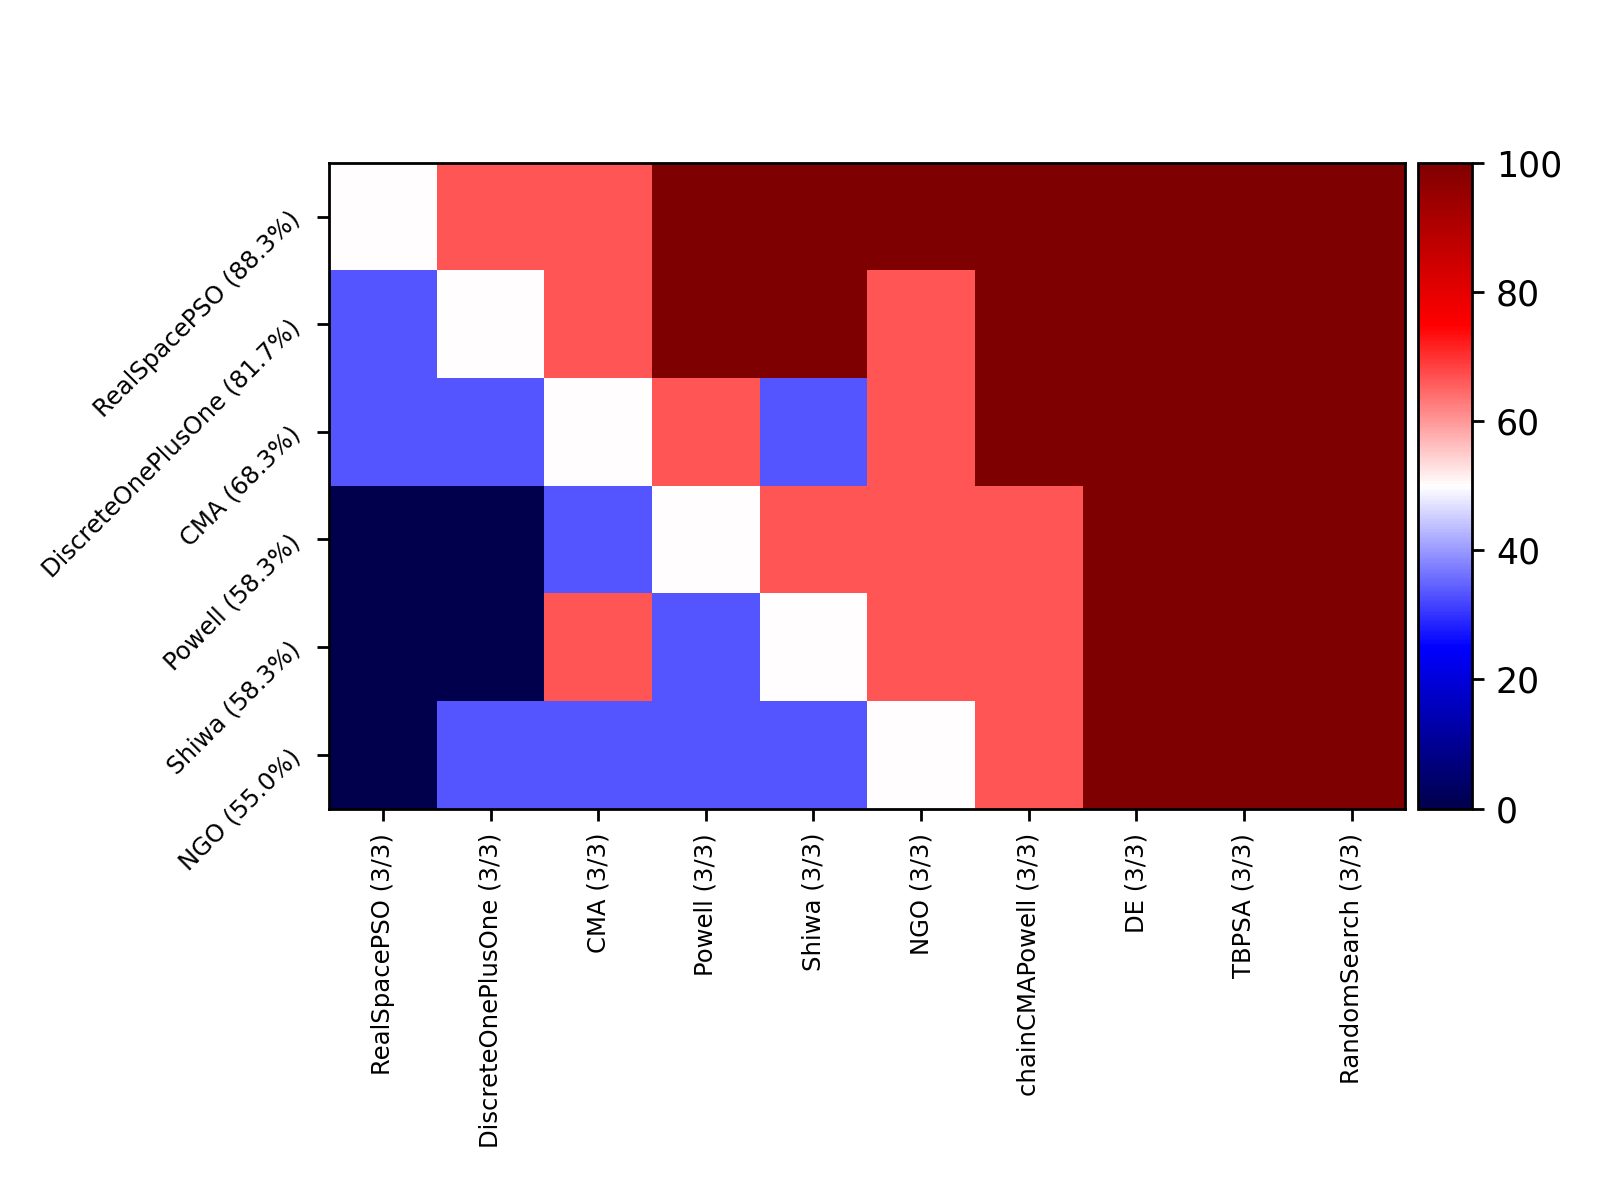
Project#6
Plot Comparison 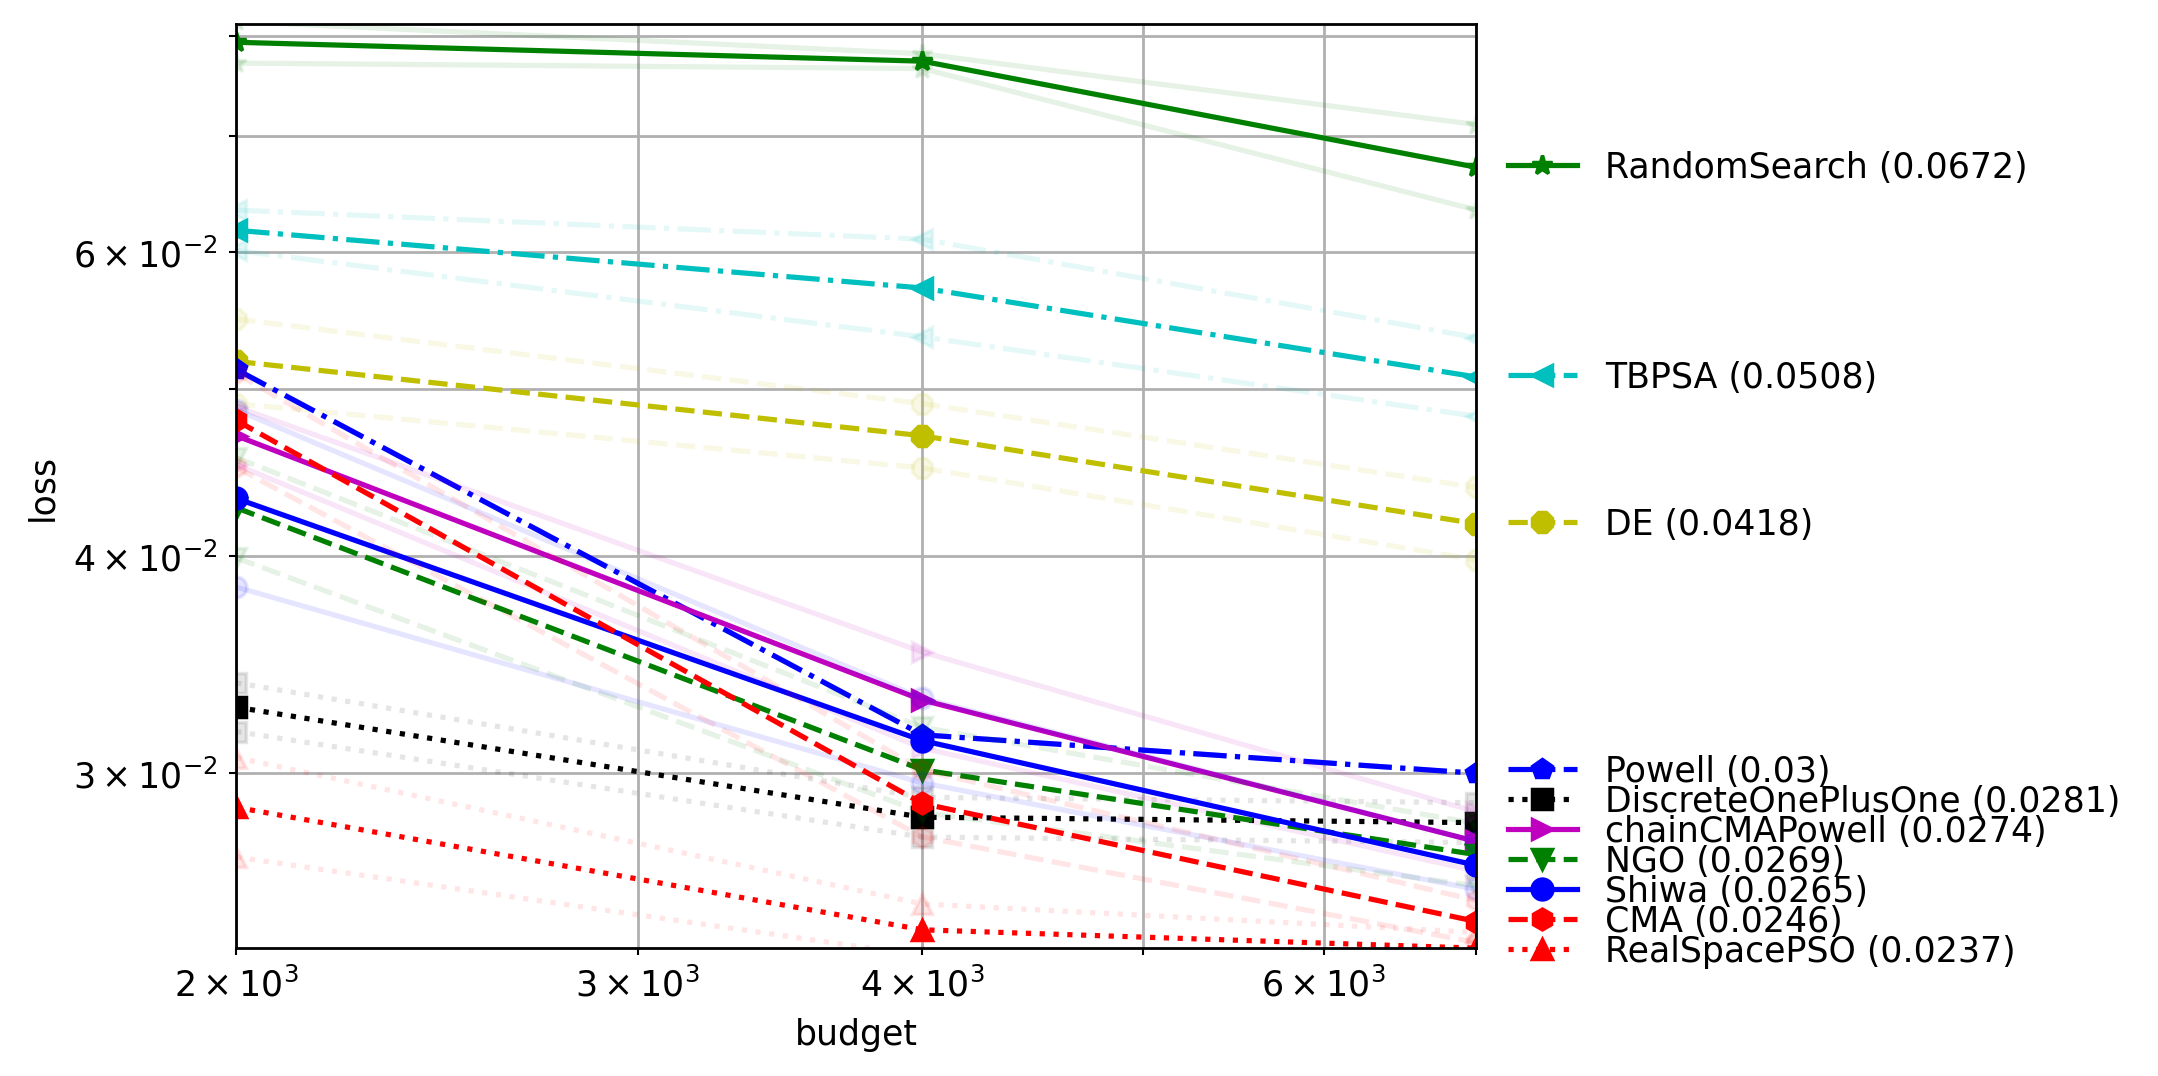
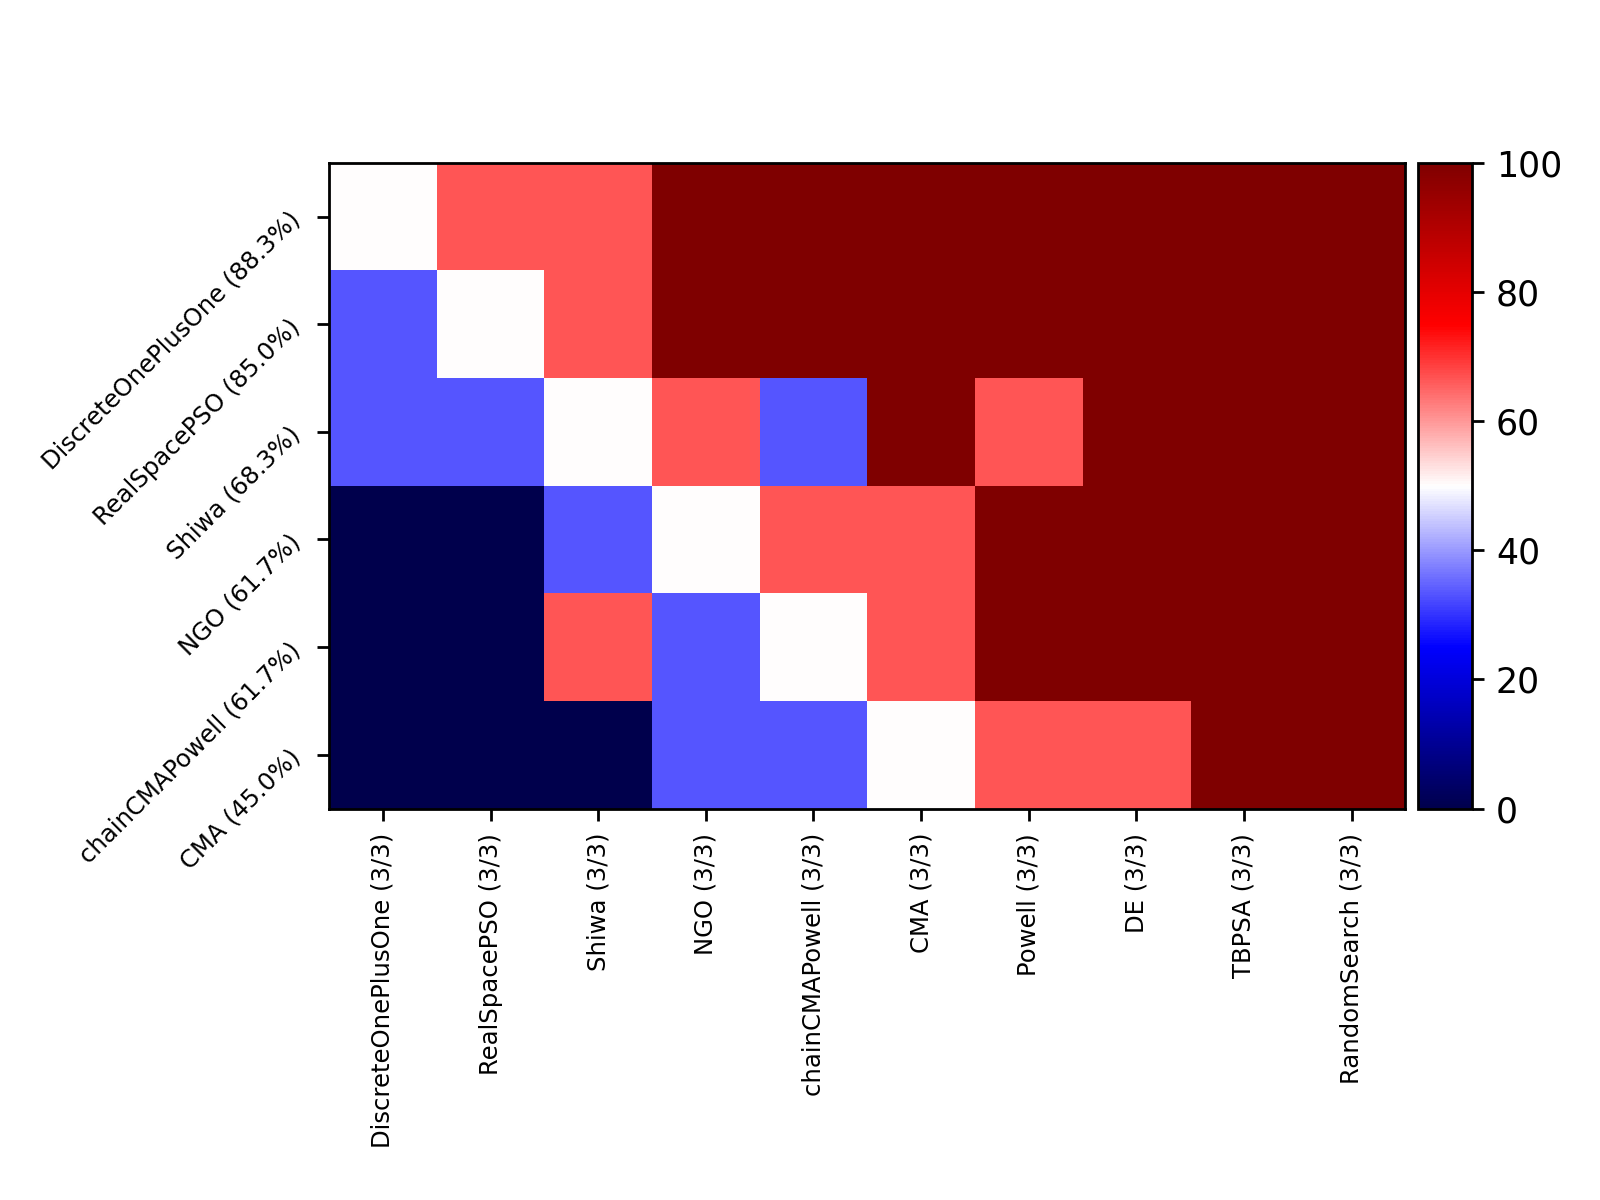
Project#7
Plot Comparison 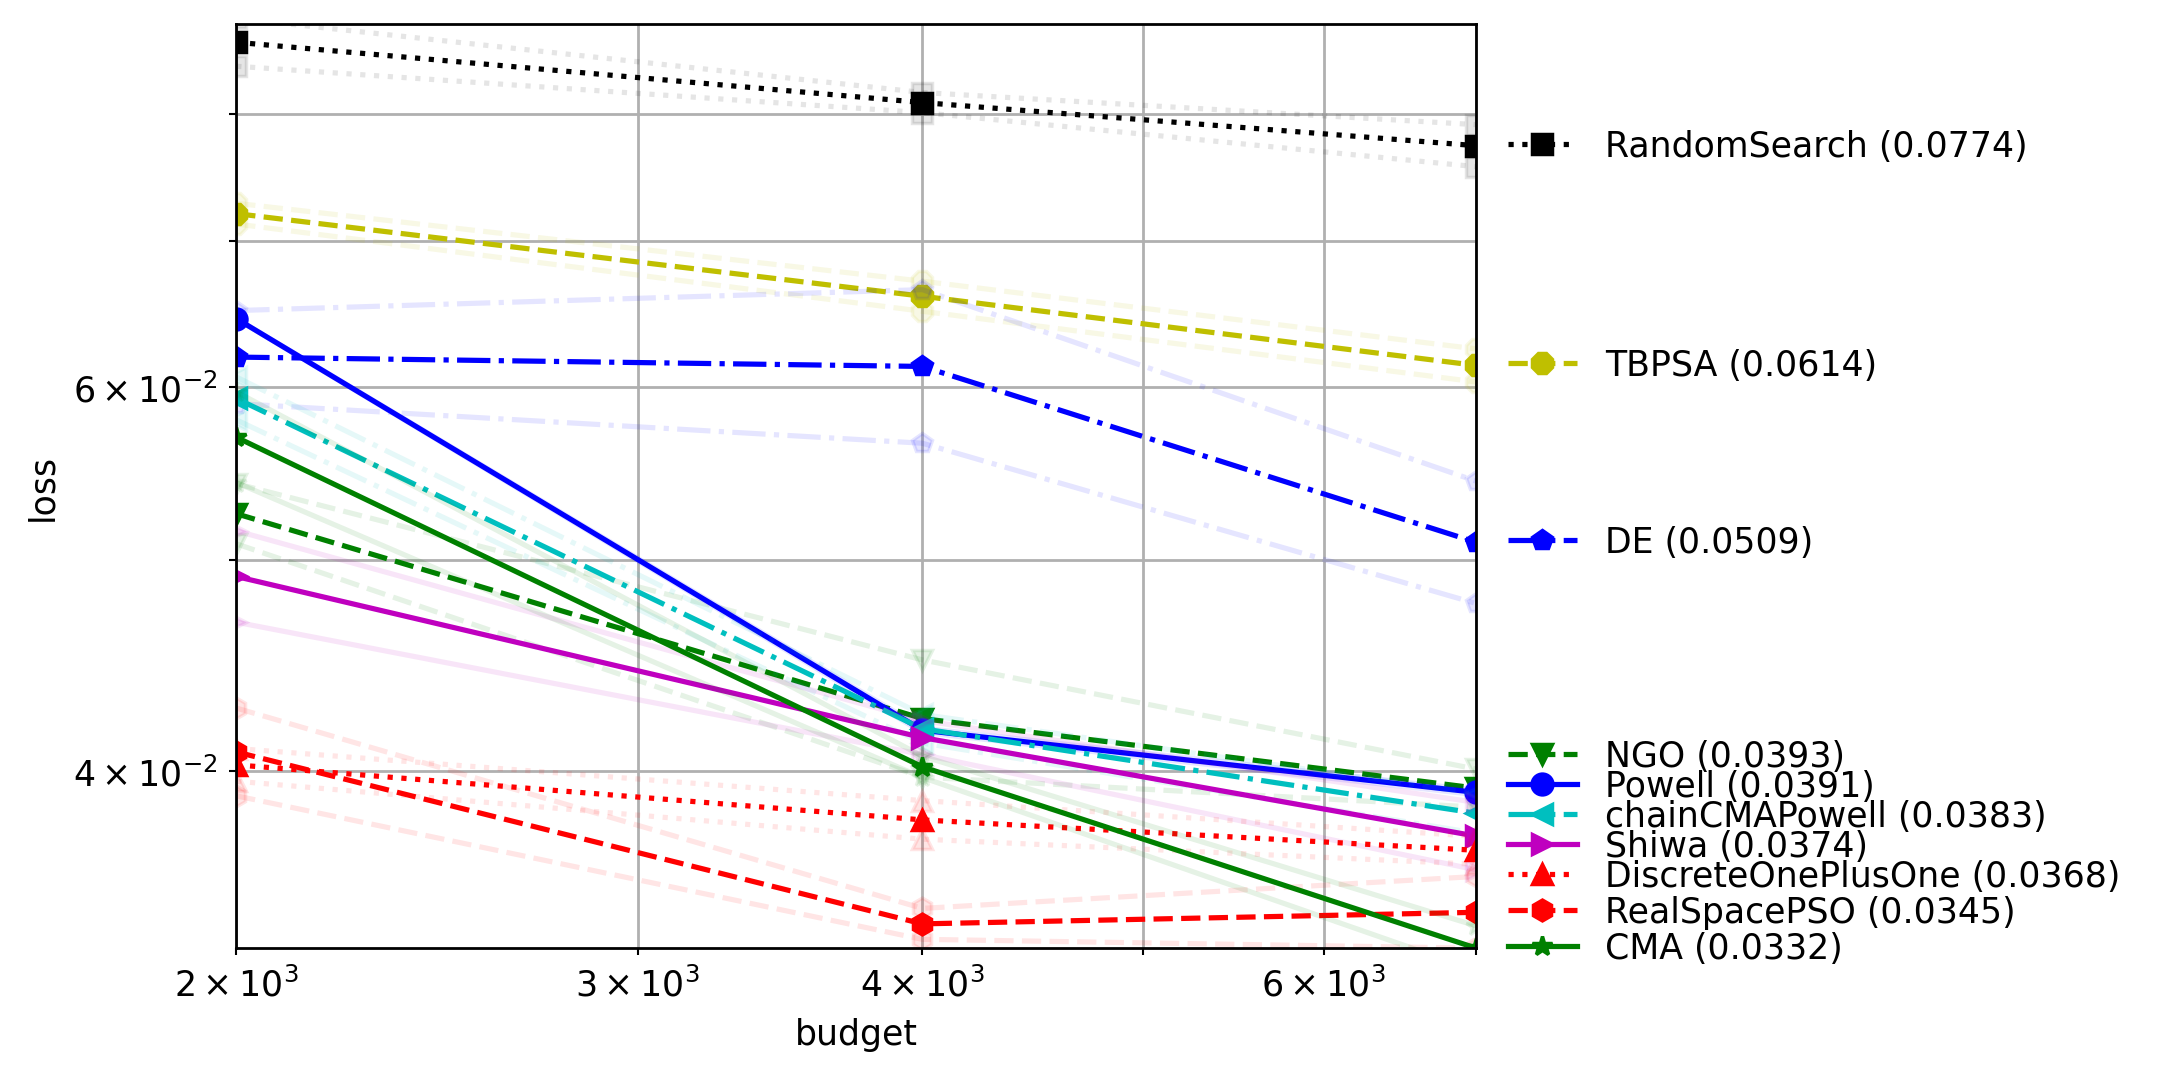
Project#8
Plot Comparison 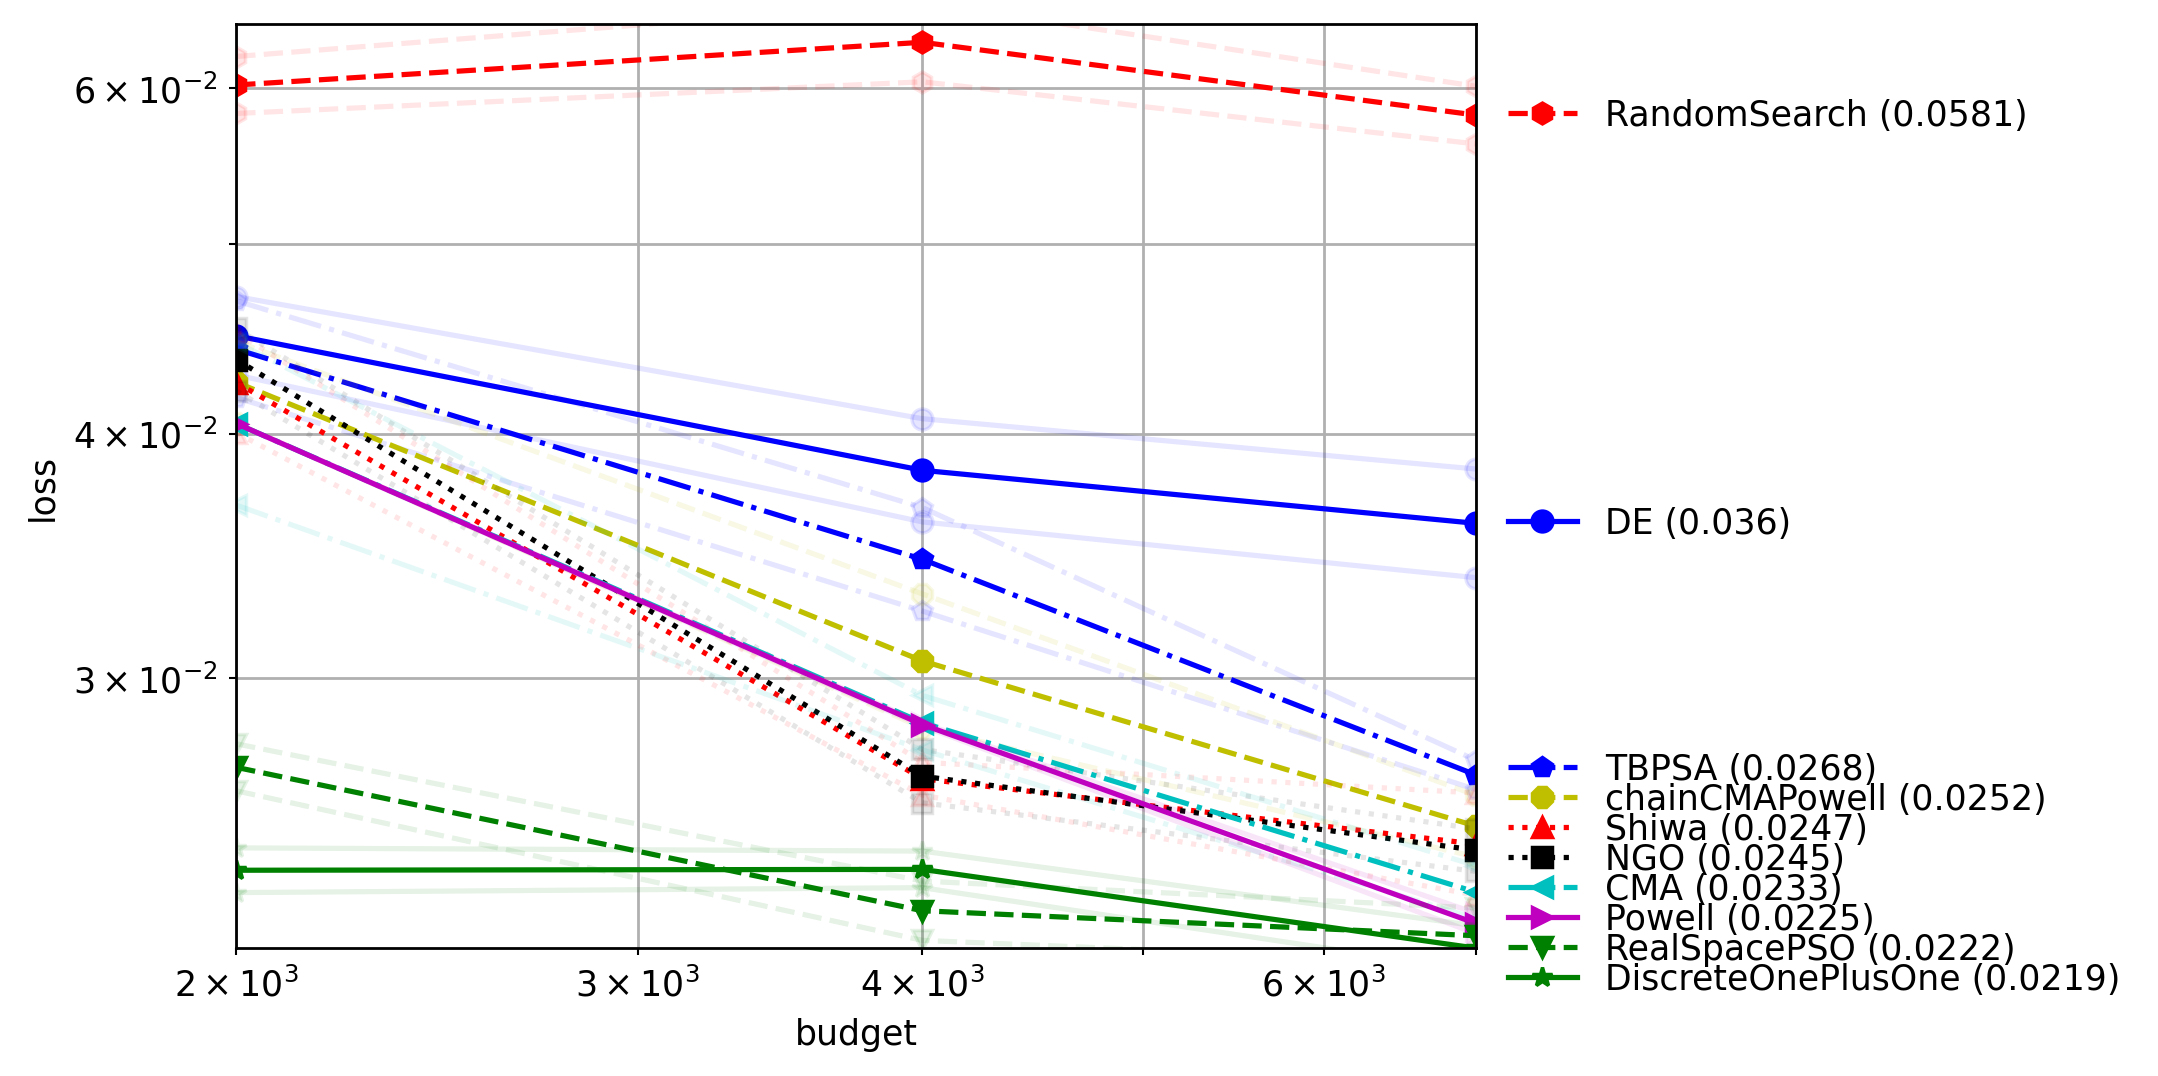
Project#9
Plot Comparison 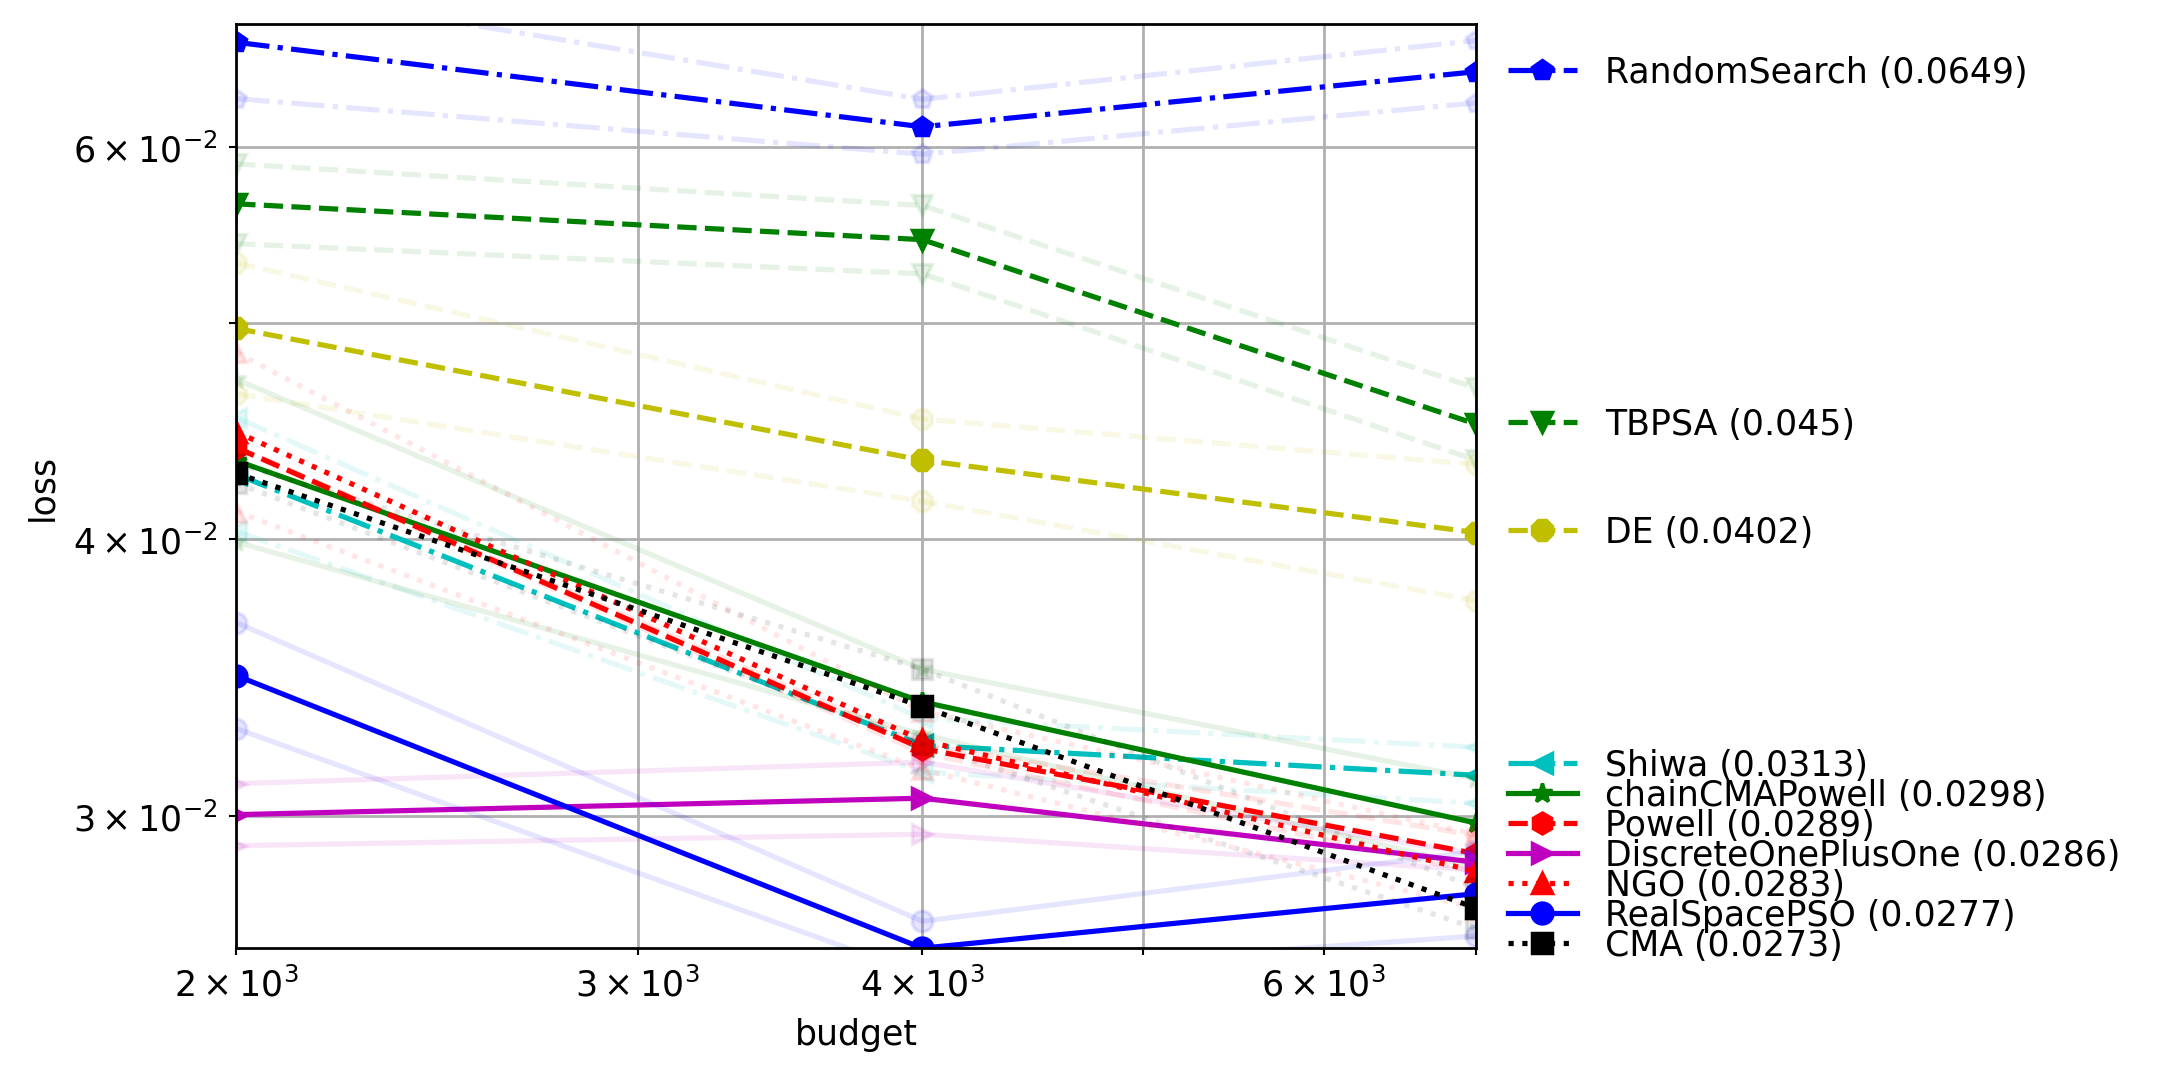
Project#10
Plot Comparison 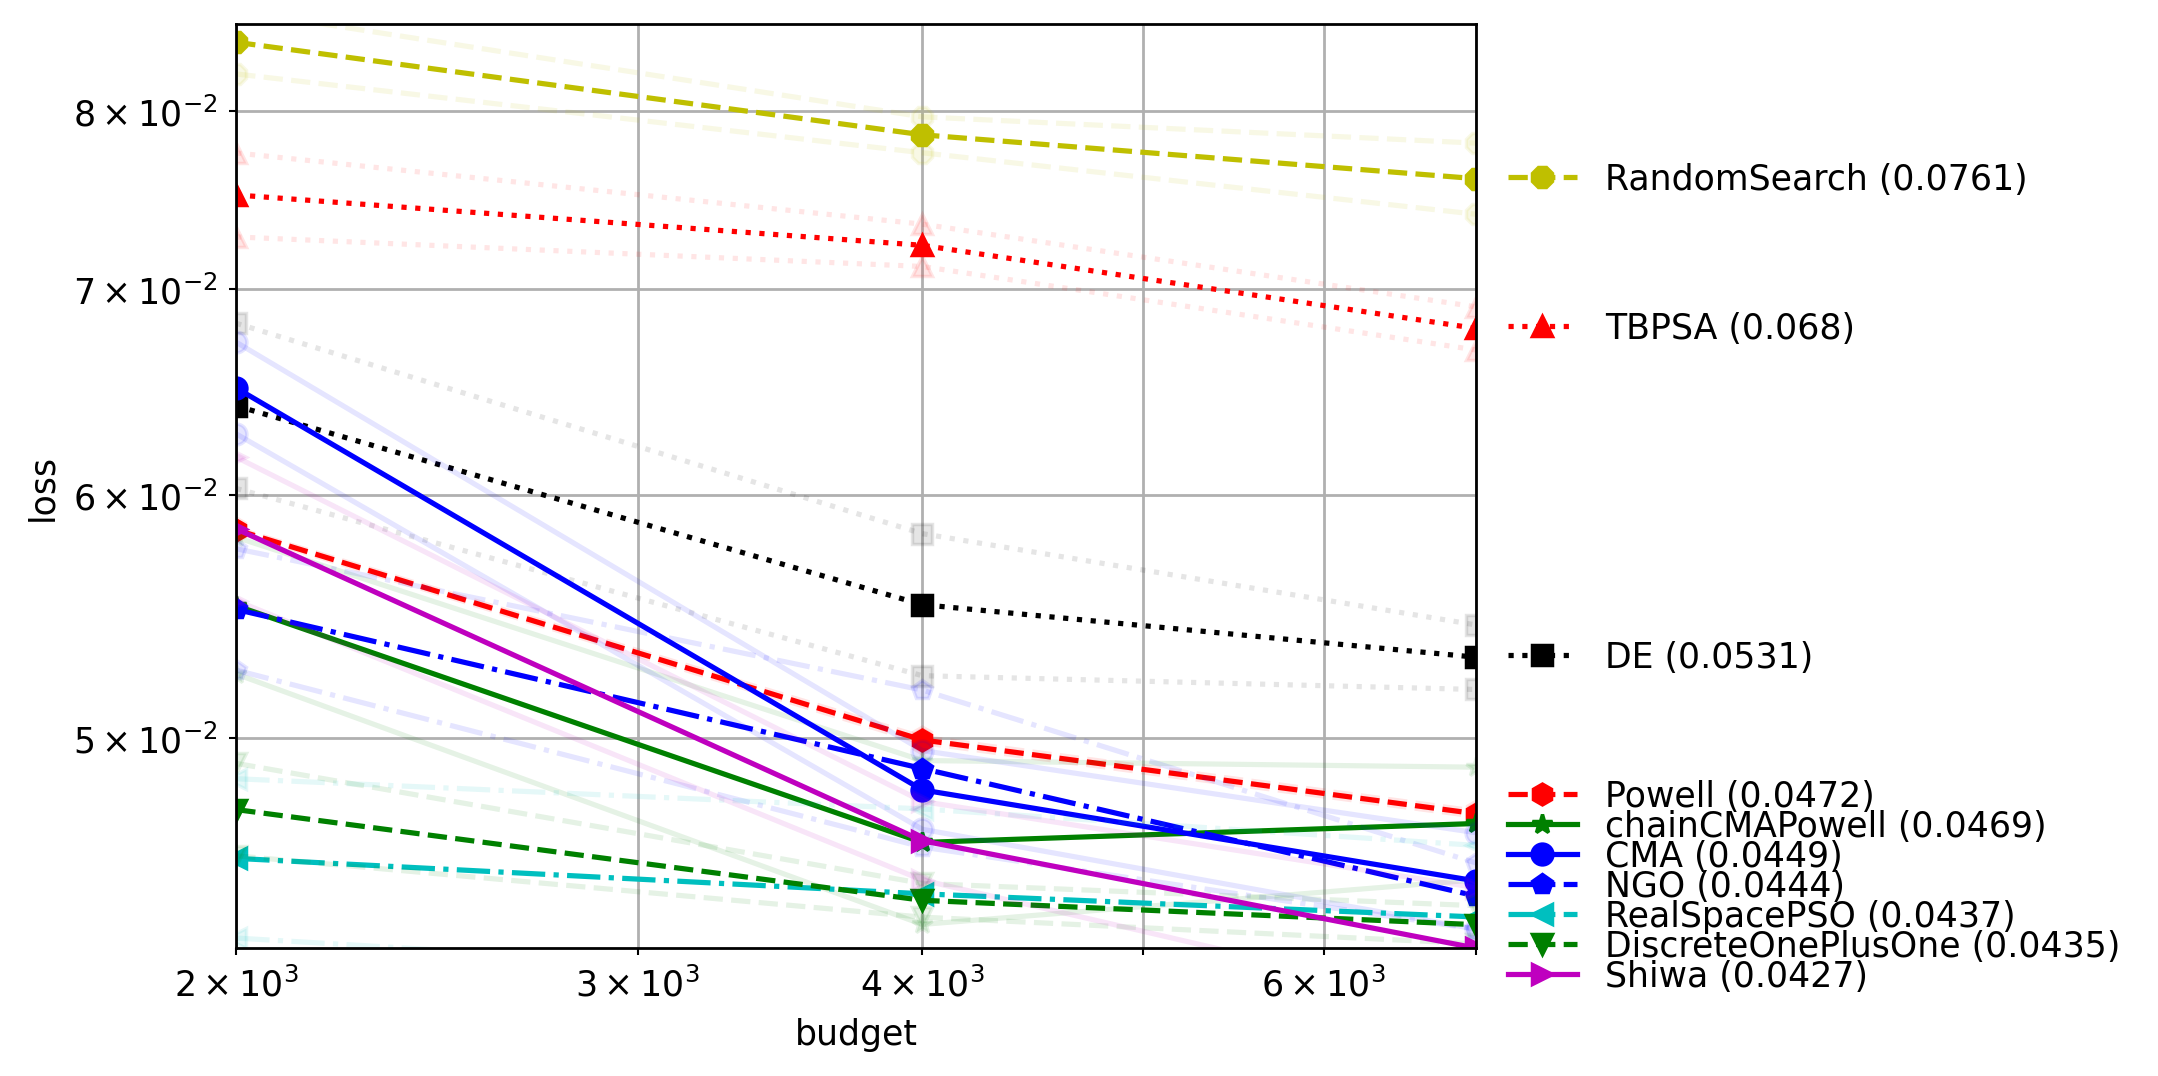
Project#11
Plot Comparison 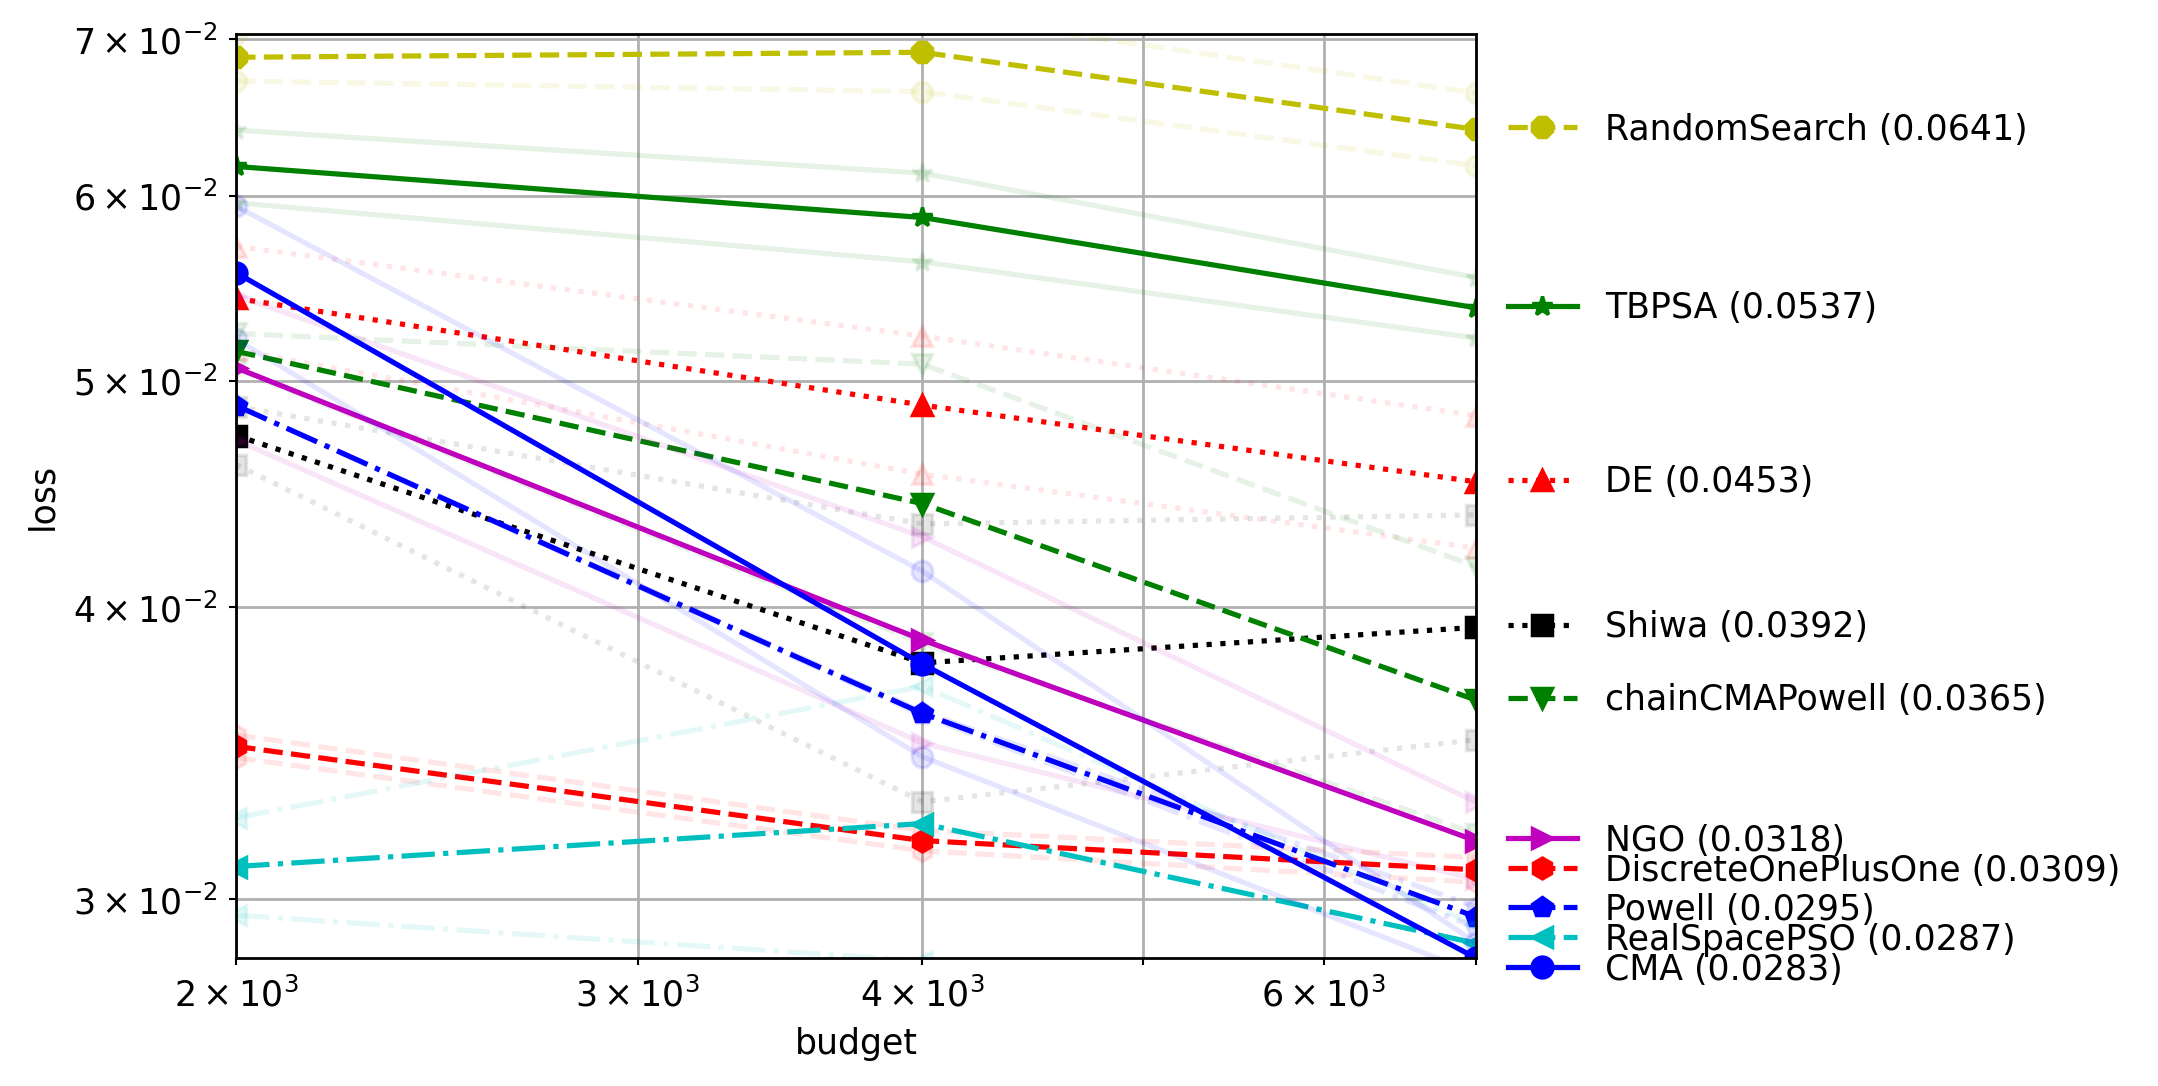
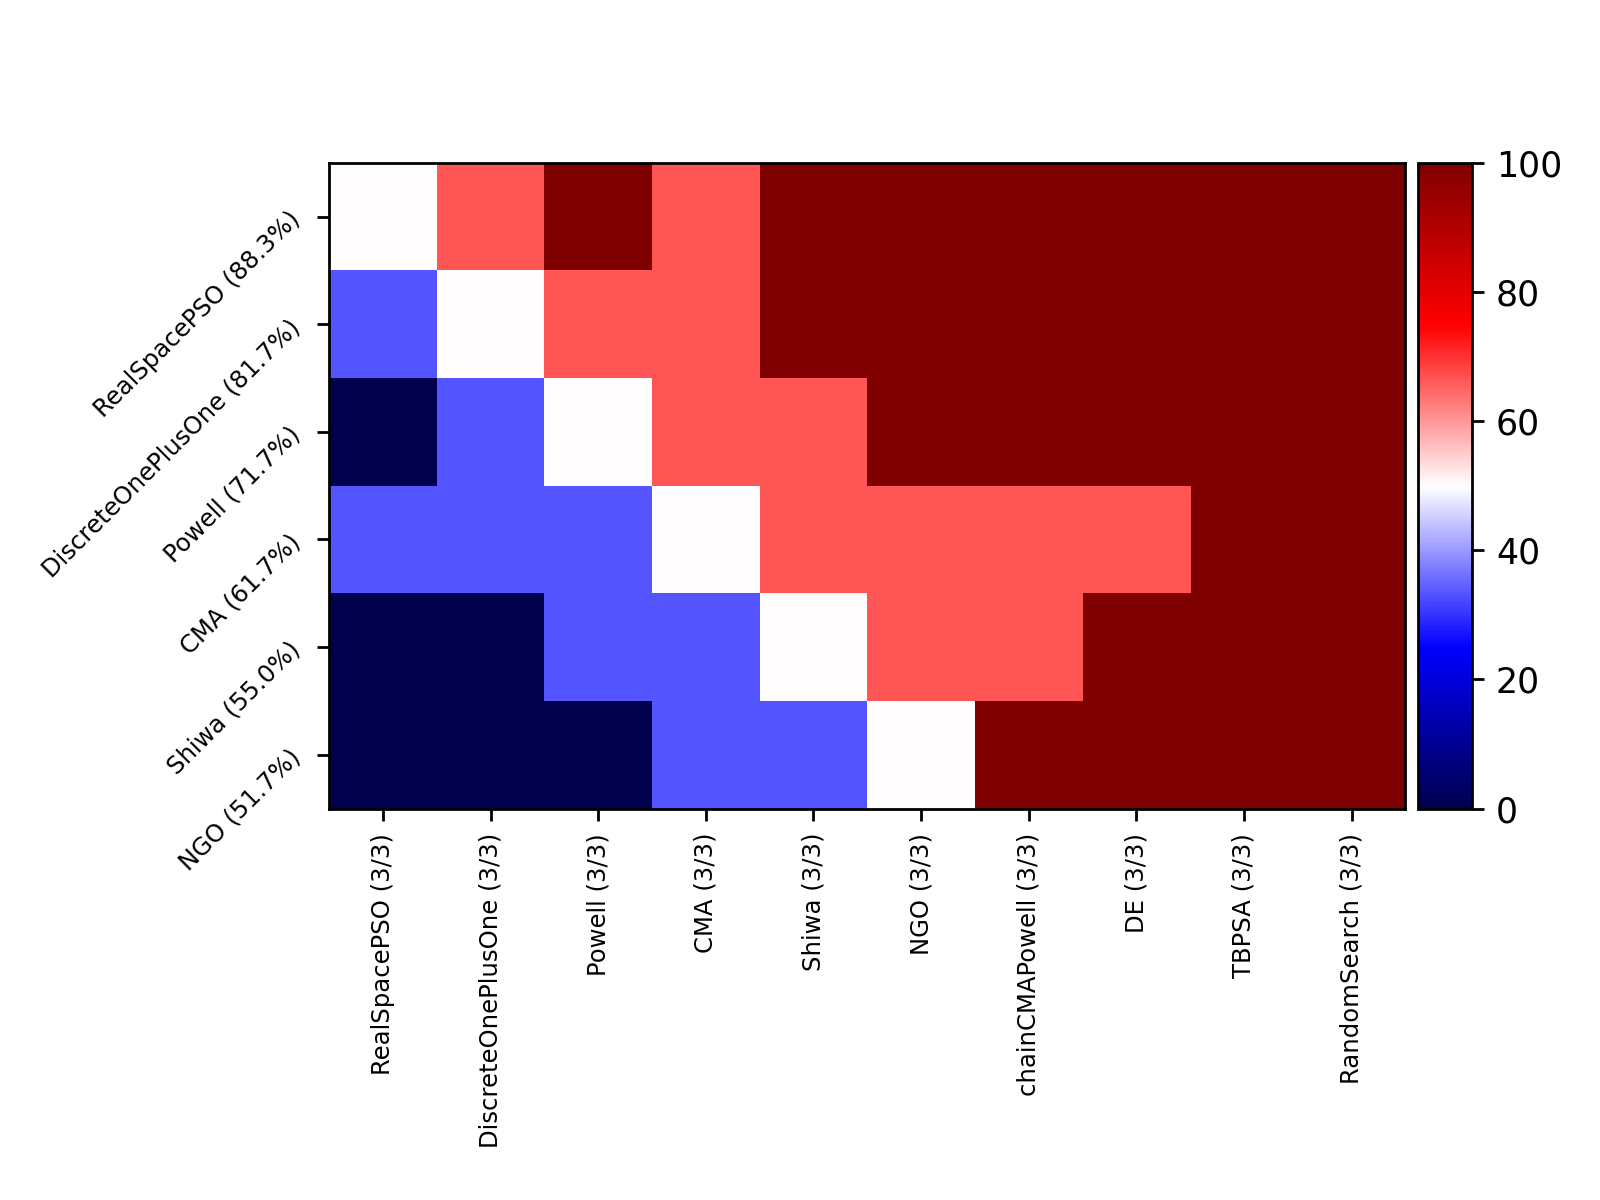
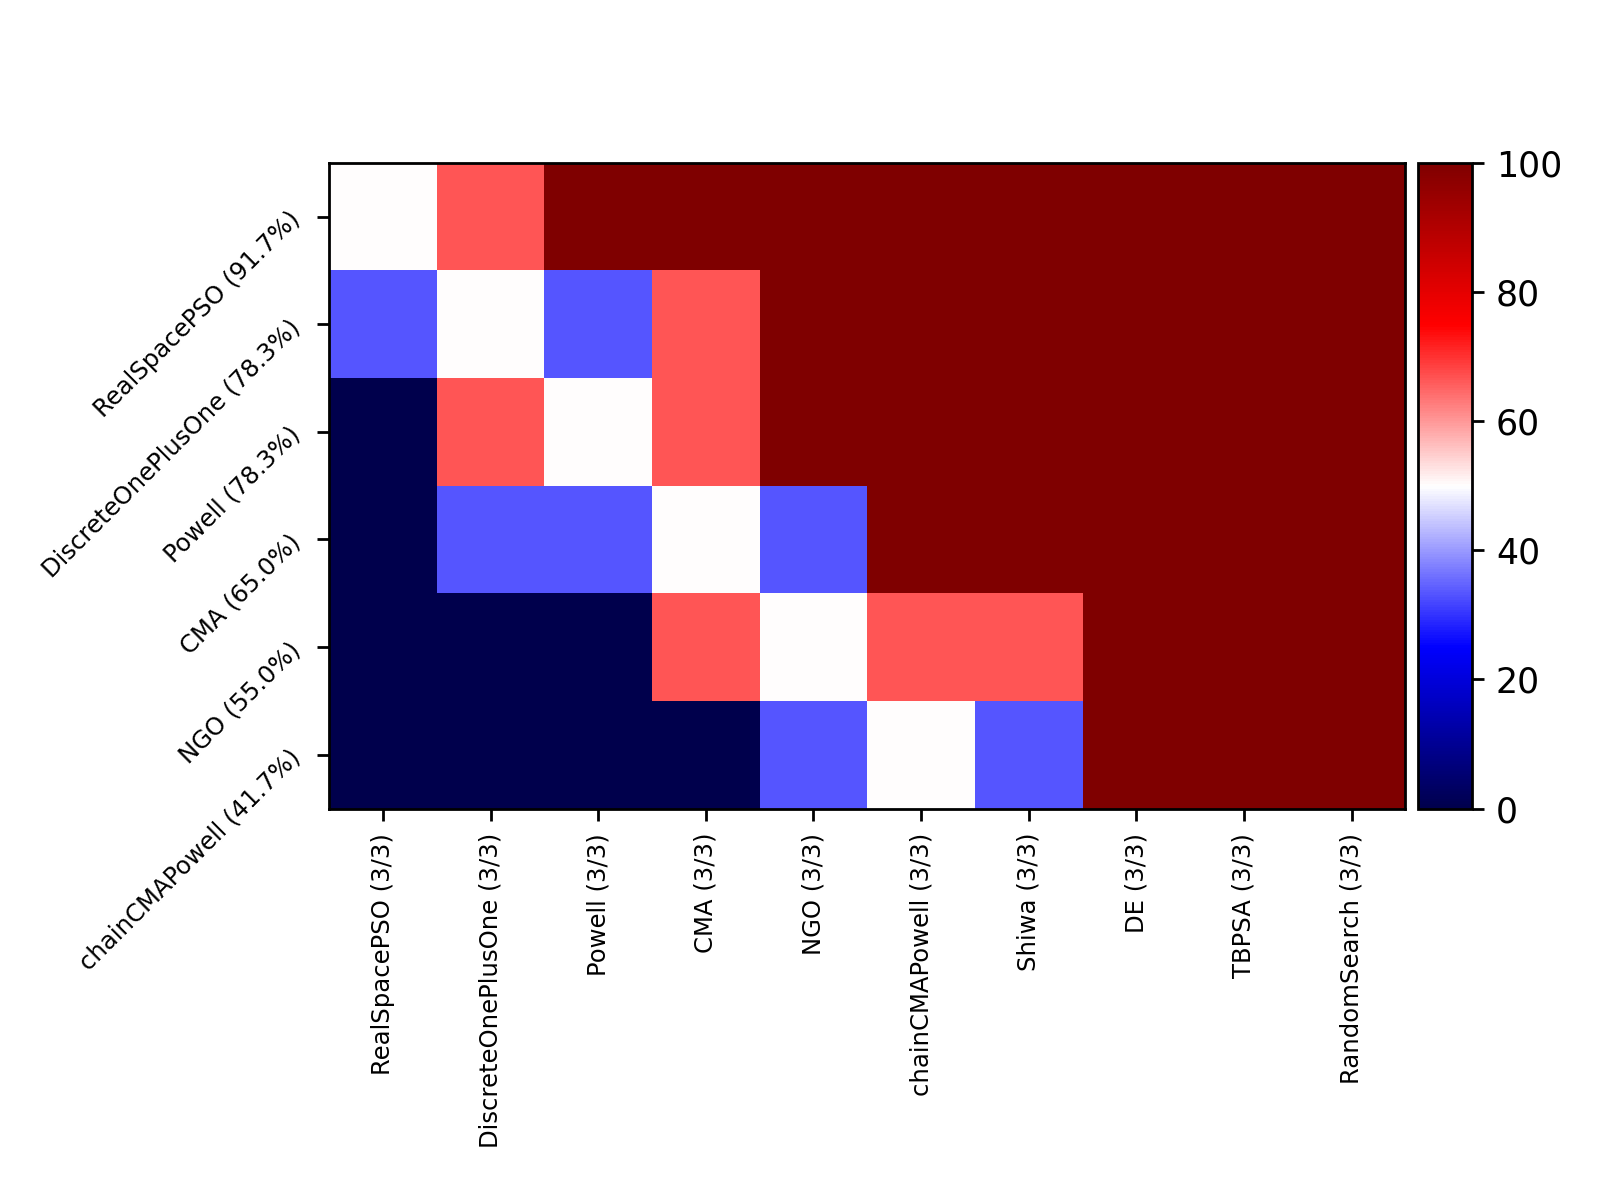
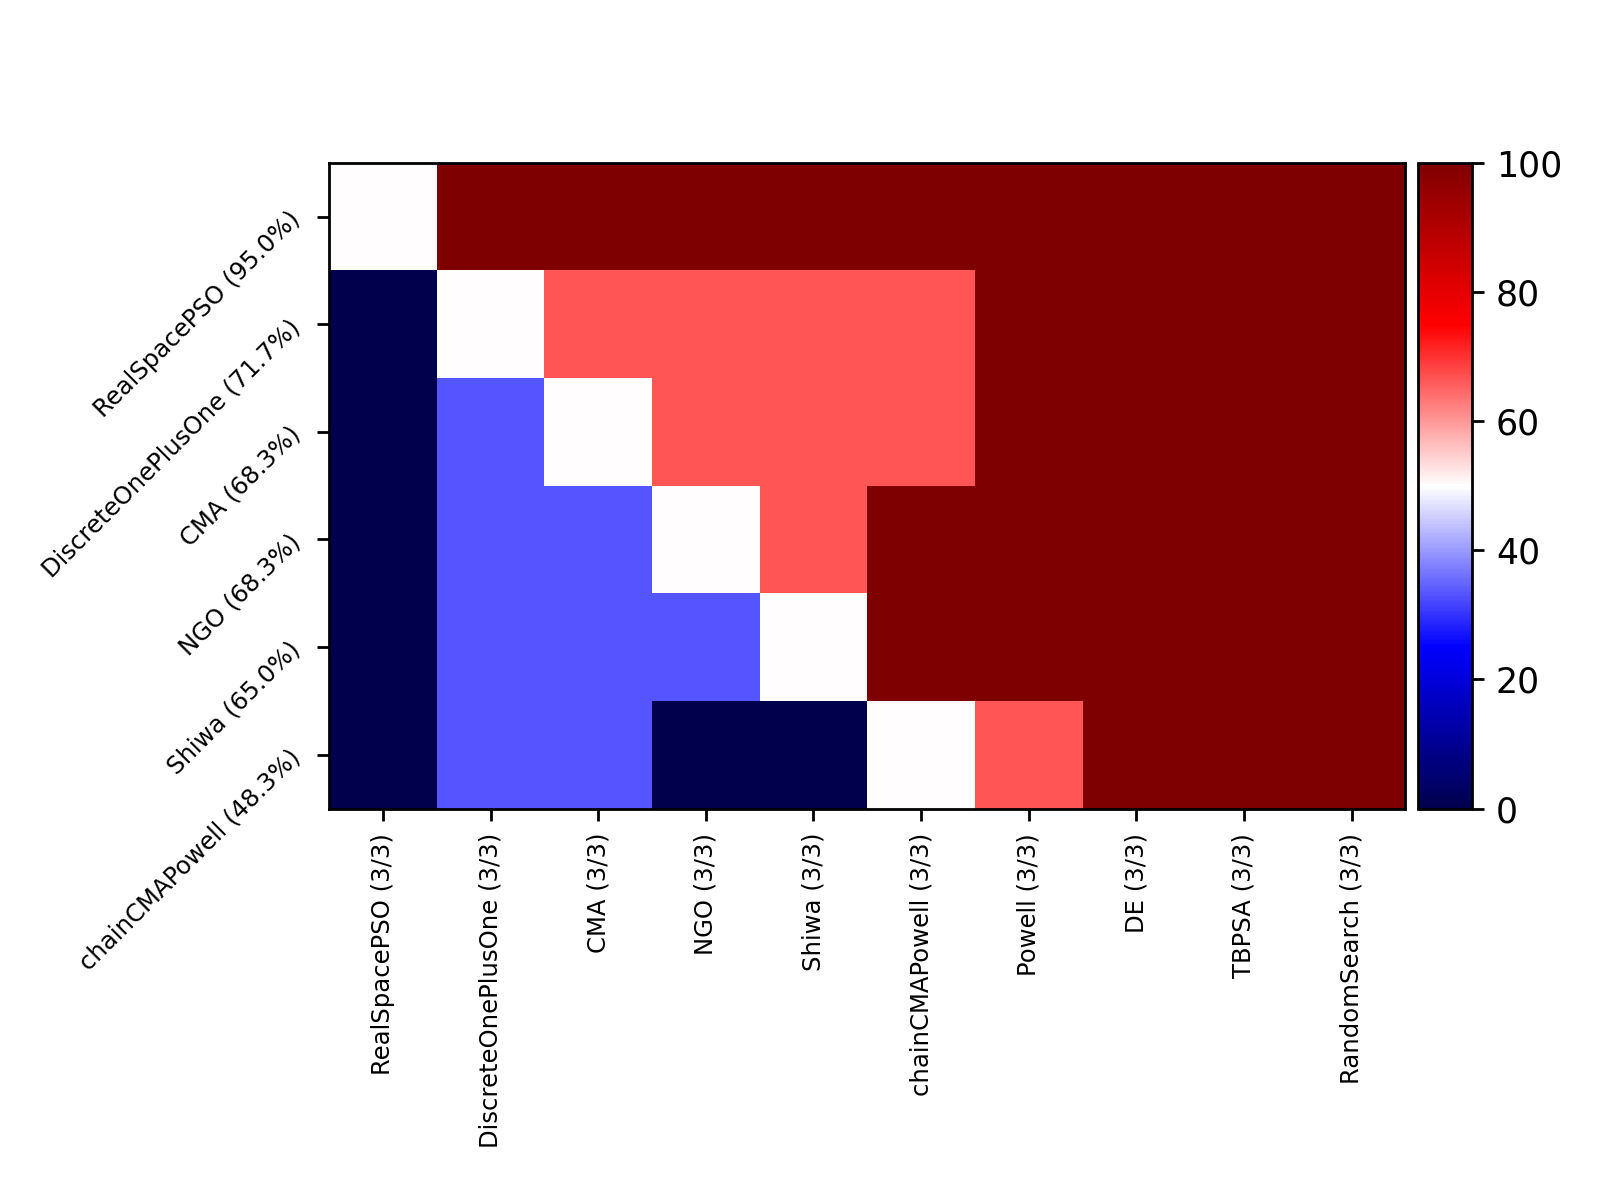
Optimizer Evaluation
For each project and optimizer we denote the best performing optimizer for that project by bold and italics, the second best by bold and the third best by italics.
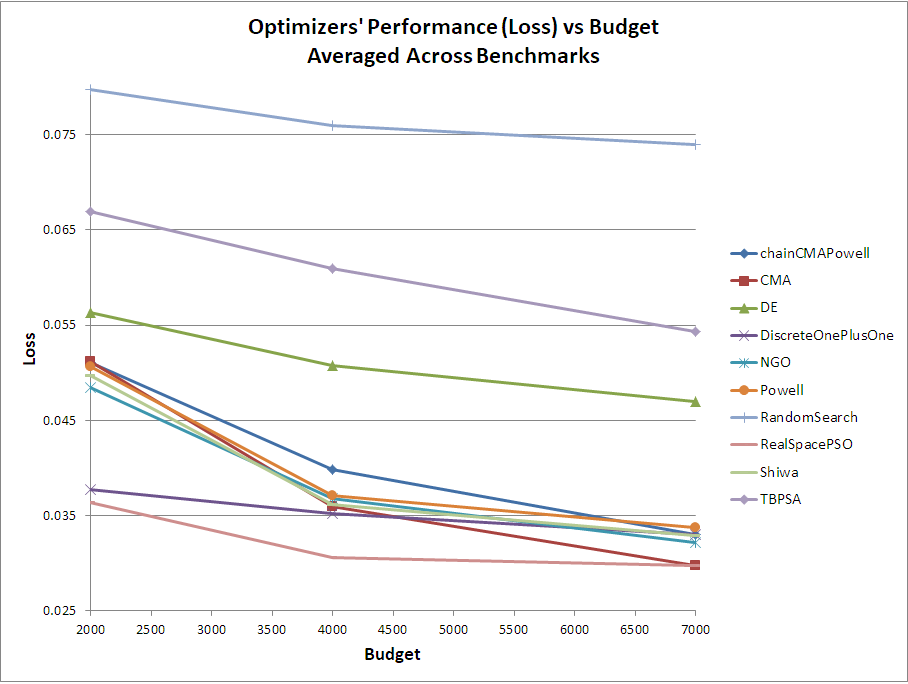
Loss
Results with respect to the optimized function values for a budget of 7000:
| Optimizer | Project#1 | Project#2 | Project#3 | Project#4 | Project#5 | Project#6 | Project#7 | Project#8 | Project#9 | Project#10 | Project#11 | Average |
|---|---|---|---|---|---|---|---|---|---|---|---|---|
| chainCMAPowell | 0.030 | 0.033 | 0.034 | 0.029 | 0.033 | 0.027 | 0.038 | 0.025 | 0.030 | 0.047 | 0.037 | 0.033 |
| CMA | 0.028 | 0.027 | 0.032 | 0.026 | 0.031 | 0.025 | 0.033 | 0.023 | 0.027 | 0.045 | 0.028 | 0.030 |
| DE | 0.051 | 0.044 | 0.064 | 0.042 | 0.048 | 0.042 | 0.051 | 0.036 | 0.040 | 0.053 | 0.045 | 0.047 |
| DiscreteOnePlusOne | 0.031 | 0.029 | 0.051 | 0.031 | 0.032 | 0.028 | 0.037 | 0.022 | 0.029 | 0.043 | 0.031 | 0.033 |
| NGO | 0.029 | 0.031 | 0.037 | 0.029 | 0.033 | 0.027 | 0.039 | 0.025 | 0.028 | 0.044 | 0.032 | 0.032 |
| Powell | 0.027 | 0.027 | 0.058 | 0.030 | 0.032 | 0.030 | 0.039 | 0.022 | 0.029 | 0.047 | 0.029 | 0.034 |
| RandomSearch | 0.088 | 0.084 | 0.084 | 0.073 | 0.076 | 0.067 | 0.077 | 0.058 | 0.065 | 0.076 | 0.064 | 0.074 |
| RealSpacePSO | 0.030 | 0.026 | 0.033 | 0.027 | 0.031 | 0.024 | 0.034 | 0.022 | 0.028 | 0.044 | 0.029 | 0.030 |
| Shiwa | 0.030 | 0.030 | 0.036 | 0.031 | 0.033 | 0.027 | 0.037 | 0.025 | 0.031 | 0.043 | 0.039 | 0.033 |
| TBPSA | 0.064 | 0.044 | 0.070 | 0.060 | 0.054 | 0.051 | 0.061 | 0.027 | 0.045 | 0.068 | 0.054 | 0.054 |
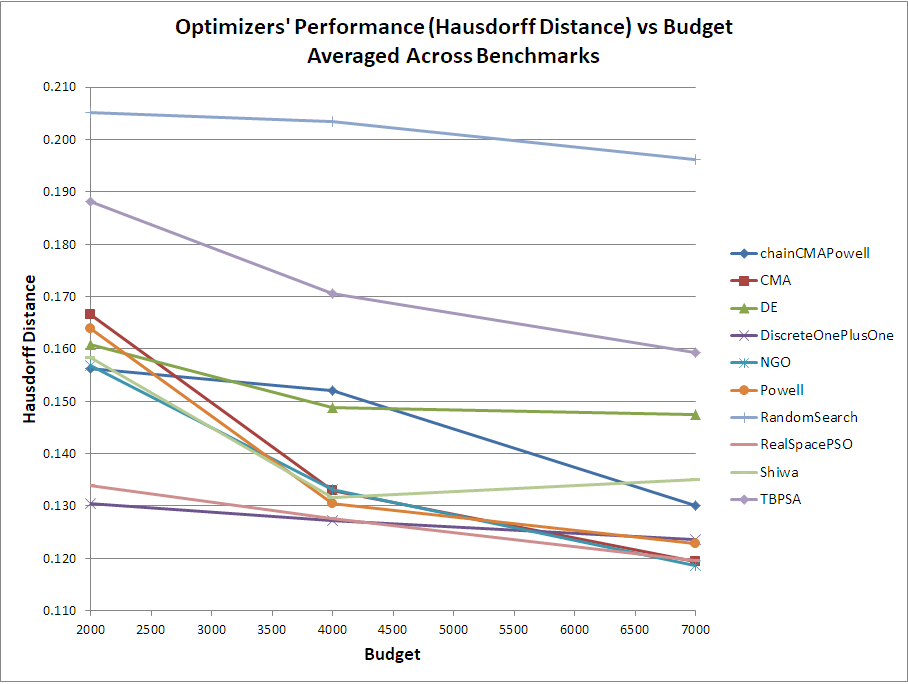
Hausdorff
Results with respect to standard metric (symmetric Hausorff distance) for a budget of 7000:
| Optimizer | Project#1 | Project#2 | Project#3 | Project#4 | Project#5 | Project#6 | Project#7 | Project#8 | Project#9 | Project#10 | Project#11 | Average |
|---|---|---|---|---|---|---|---|---|---|---|---|---|
| chainCMAPowell | 0.072 | 0.067 | 0.068 | 0.064 | 0.103 | 0.108 | 0.118 | 0.060 | 0.063 | 0.547 | 0.162 | 0.130 |
| CMA | 0.091 | 0.063 | 0.074 | 0.064 | 0.105 | 0.105 | 0.095 | 0.061 | 0.059 | 0.539 | 0.057 | 0.119 |
| DE | 0.117 | 0.094 | 0.122 | 0.085 | 0.119 | 0.123 | 0.151 | 0.078 | 0.090 | 0.537 | 0.106 | 0.148 |
| DiscreteOnePlusOne | 0.069 | 0.057 | 0.106 | 0.077 | 0.111 | 0.112 | 0.111 | 0.051 | 0.056 | 0.533 | 0.076 | 0.124 |
| NGO | 0.068 | 0.064 | 0.068 | 0.061 | 0.096 | 0.113 | 0.114 | 0.056 | 0.056 | 0.543 | 0.063 | 0.119 |
| Powell | 0.068 | 0.059 | 0.121 | 0.072 | 0.107 | 0.107 | 0.091 | 0.054 | 0.057 | 0.540 | 0.075 | 0.123 |
| RandomSearch | 0.169 | 0.189 | 0.173 | 0.144 | 0.192 | 0.165 | 0.207 | 0.137 | 0.160 | 0.481 | 0.139 | 0.196 |
| RealSpacePSO | 0.090 | 0.062 | 0.069 | 0.056 | 0.106 | 0.113 | 0.102 | 0.057 | 0.065 | 0.536 | 0.058 | 0.120 |
| Shiwa | 0.075 | 0.060 | 0.074 | 0.115 | 0.102 | 0.109 | 0.103 | 0.051 | 0.067 | 0.547 | 0.183 | 0.135 |
| TBPSA | 0.137 | 0.082 | 0.139 | 0.133 | 0.155 | 0.142 | 0.148 | 0.079 | 0.103 | 0.479 | 0.156 | 0.159 |
Combined
Results with respect to standard metric (symmetric Hausorff distance) across all budgets (2000, 4000, 7000):
| Loss | Hausorff |
|---|---|
 |  |